


As carbon intensity of grid electricity can range from 29g to 635g of CO2 per kWh, paper manufacturers are moving towards local renewable generation. Eduardo De Almeida, Manager, AFRY Process Industries Spain, suggests a roadmap to industrial decarbonisation.
Higher energy costs, environmental pressures and legislation are increasingly pushing industrial companies towards decarbonisation. Yet there are many identified options of how to decarbonise operations. Energy use at tissue plants, as with many other industrial facilities, is a significant contributor to greenhouse gas (GHG) emissions. The tissue industry encompasses various processes including the operation of paper machines, drying processes and transportation, which require substantial energy inputs. The type of energy source (e.g., fossil fuels, renewable energy) and the efficiency of energy use can vary among facilities, impacting emissions.
Here we examine how a tissue mill can decarbonise its energy input and sources. A logical option is the substitution of gas-consuming equipment. The industry is seeing gas-fired boilers being replaced by biomass in places where there is good availability. Furthermore, the first electric drying hoods are appearing on the market.
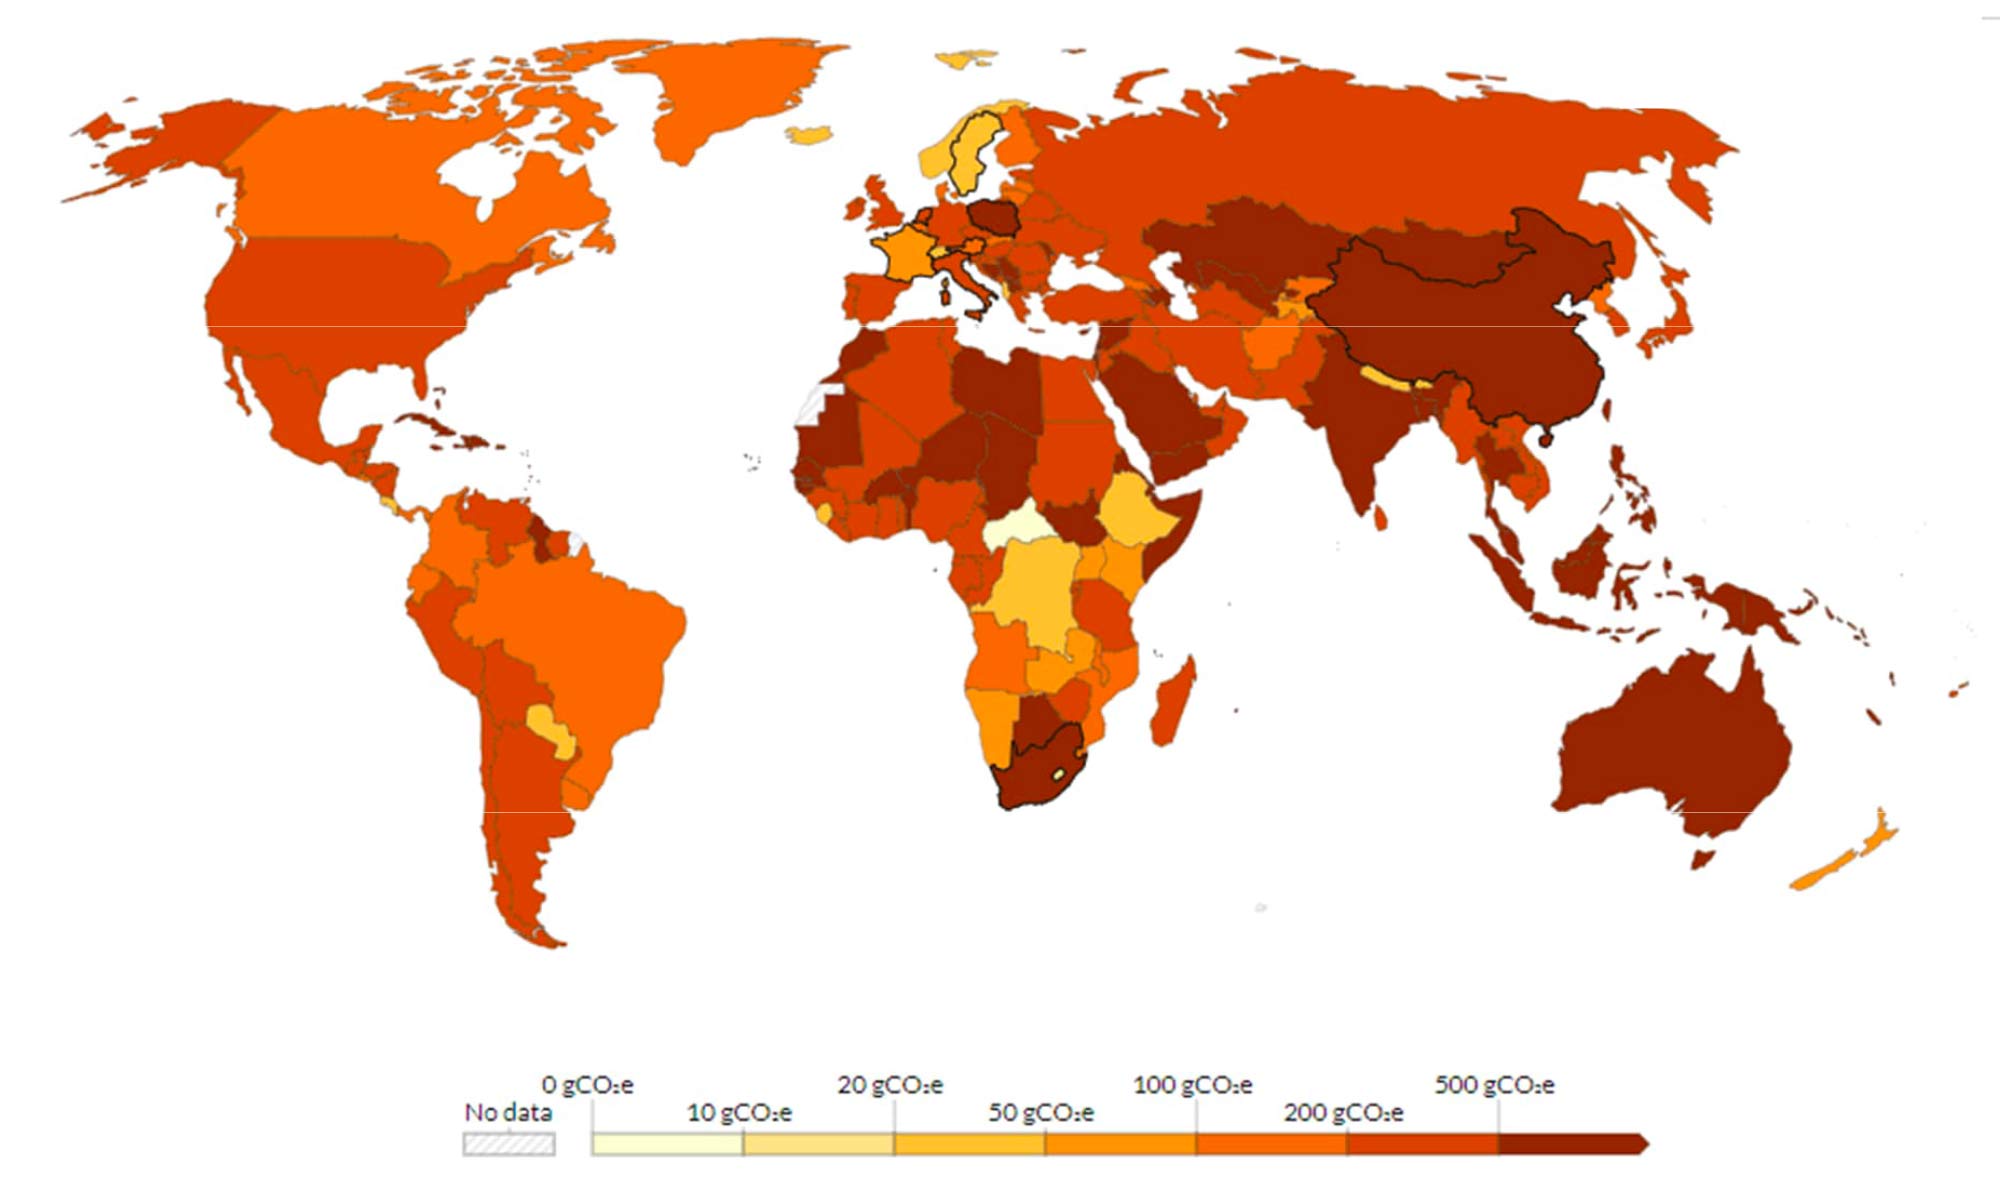
Switching to electric might seem a good way to decarbonise. However, producers are still exposed to the carbon intensity of grid electricity of their countries. In Europe for instance, this may range from 29 grams of CO2 per kWh in Norway to 635 grams in Poland. In a world where legislation and consumers require low-carbon products, this puts producers located in high CO2 intensive countries at risk – especially those that export to low carbon-intensive countries.
Often green electricity may be sourced, albeit at a higher price than at the “regular” market. As a result, paper-making companies are considering local renewable energy generation as an alternative to buying electricity from the grid.
In this article, we’ll explore how to size a renewable energy generation system on a tissue mill, using weather and market data from Spain.
The risk of averages
Many financial analyses are carried out using average yearly forecasts. Given the daily and even hourly volatility of electricity prices, this approach can lead to significant errors. Furthermore, grid energy prices are correlated to renewable energy generation, so any simulation should take this into account. This is illustrated by Chart 1, showing the Spanish electricity market and its power generation.
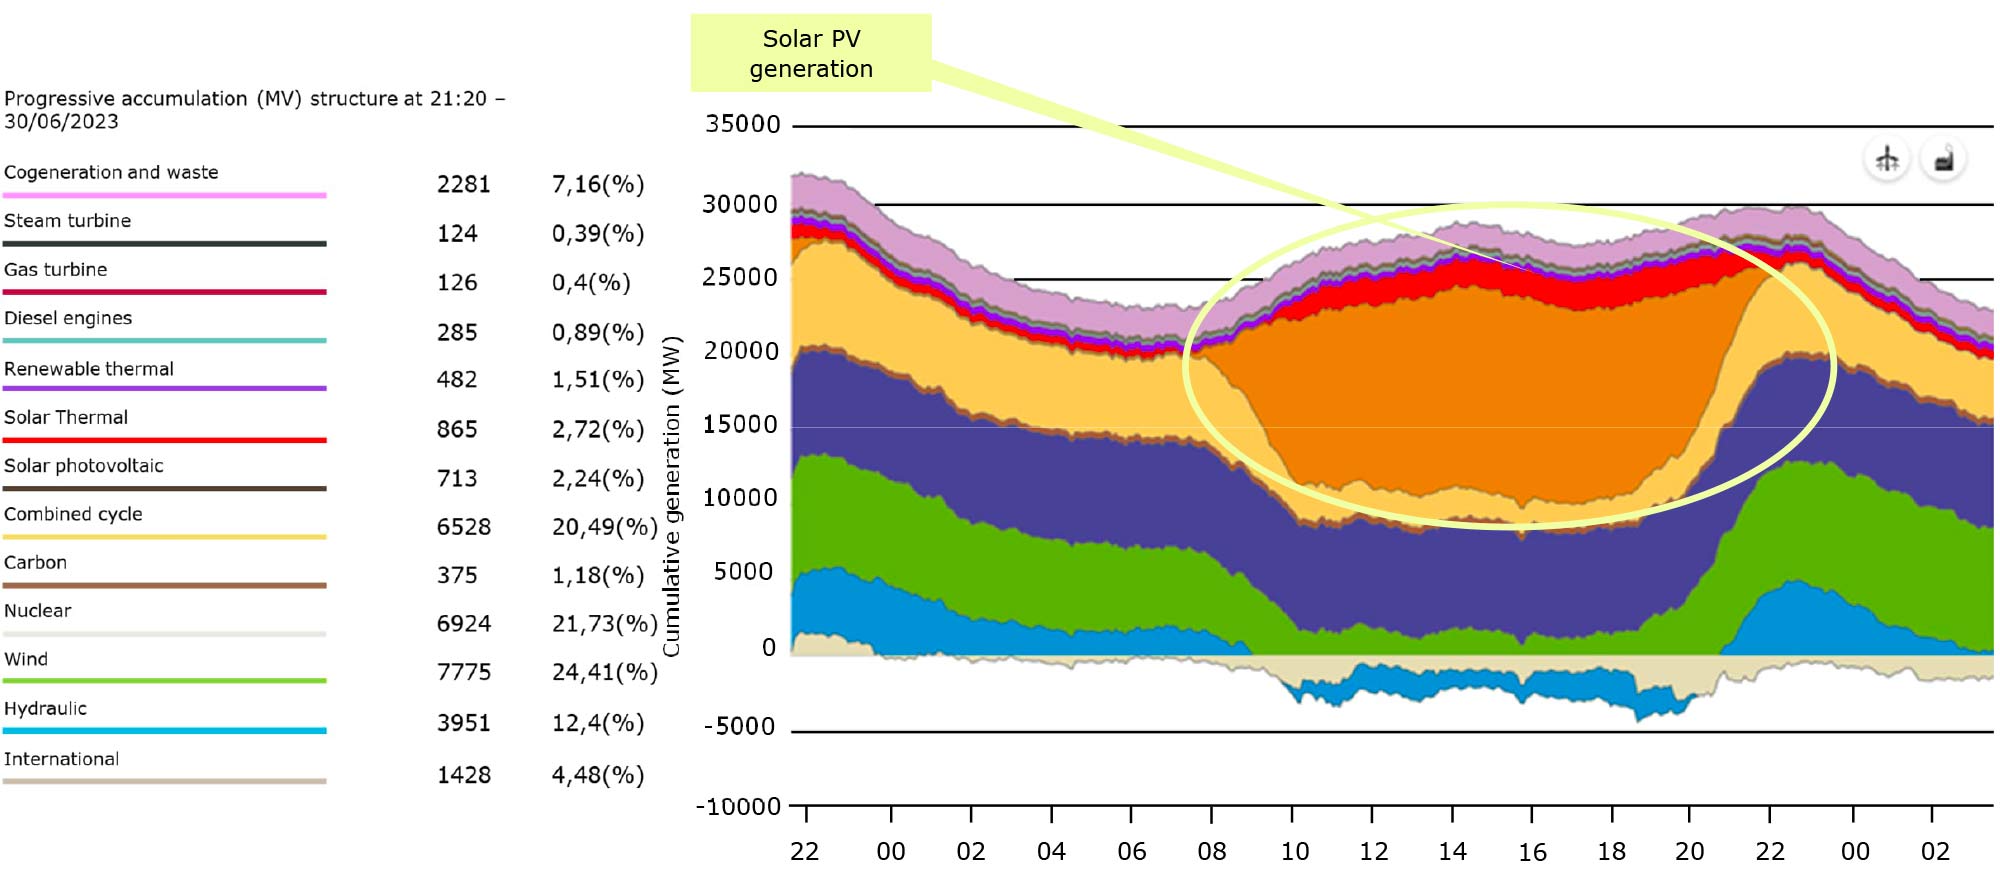
As seen in the chart, at daylight hours electricity generation from solar sources can amount to over 40% of Spain’s overall production. This is pushing prices down towards central hours, as seen on Chart 2.
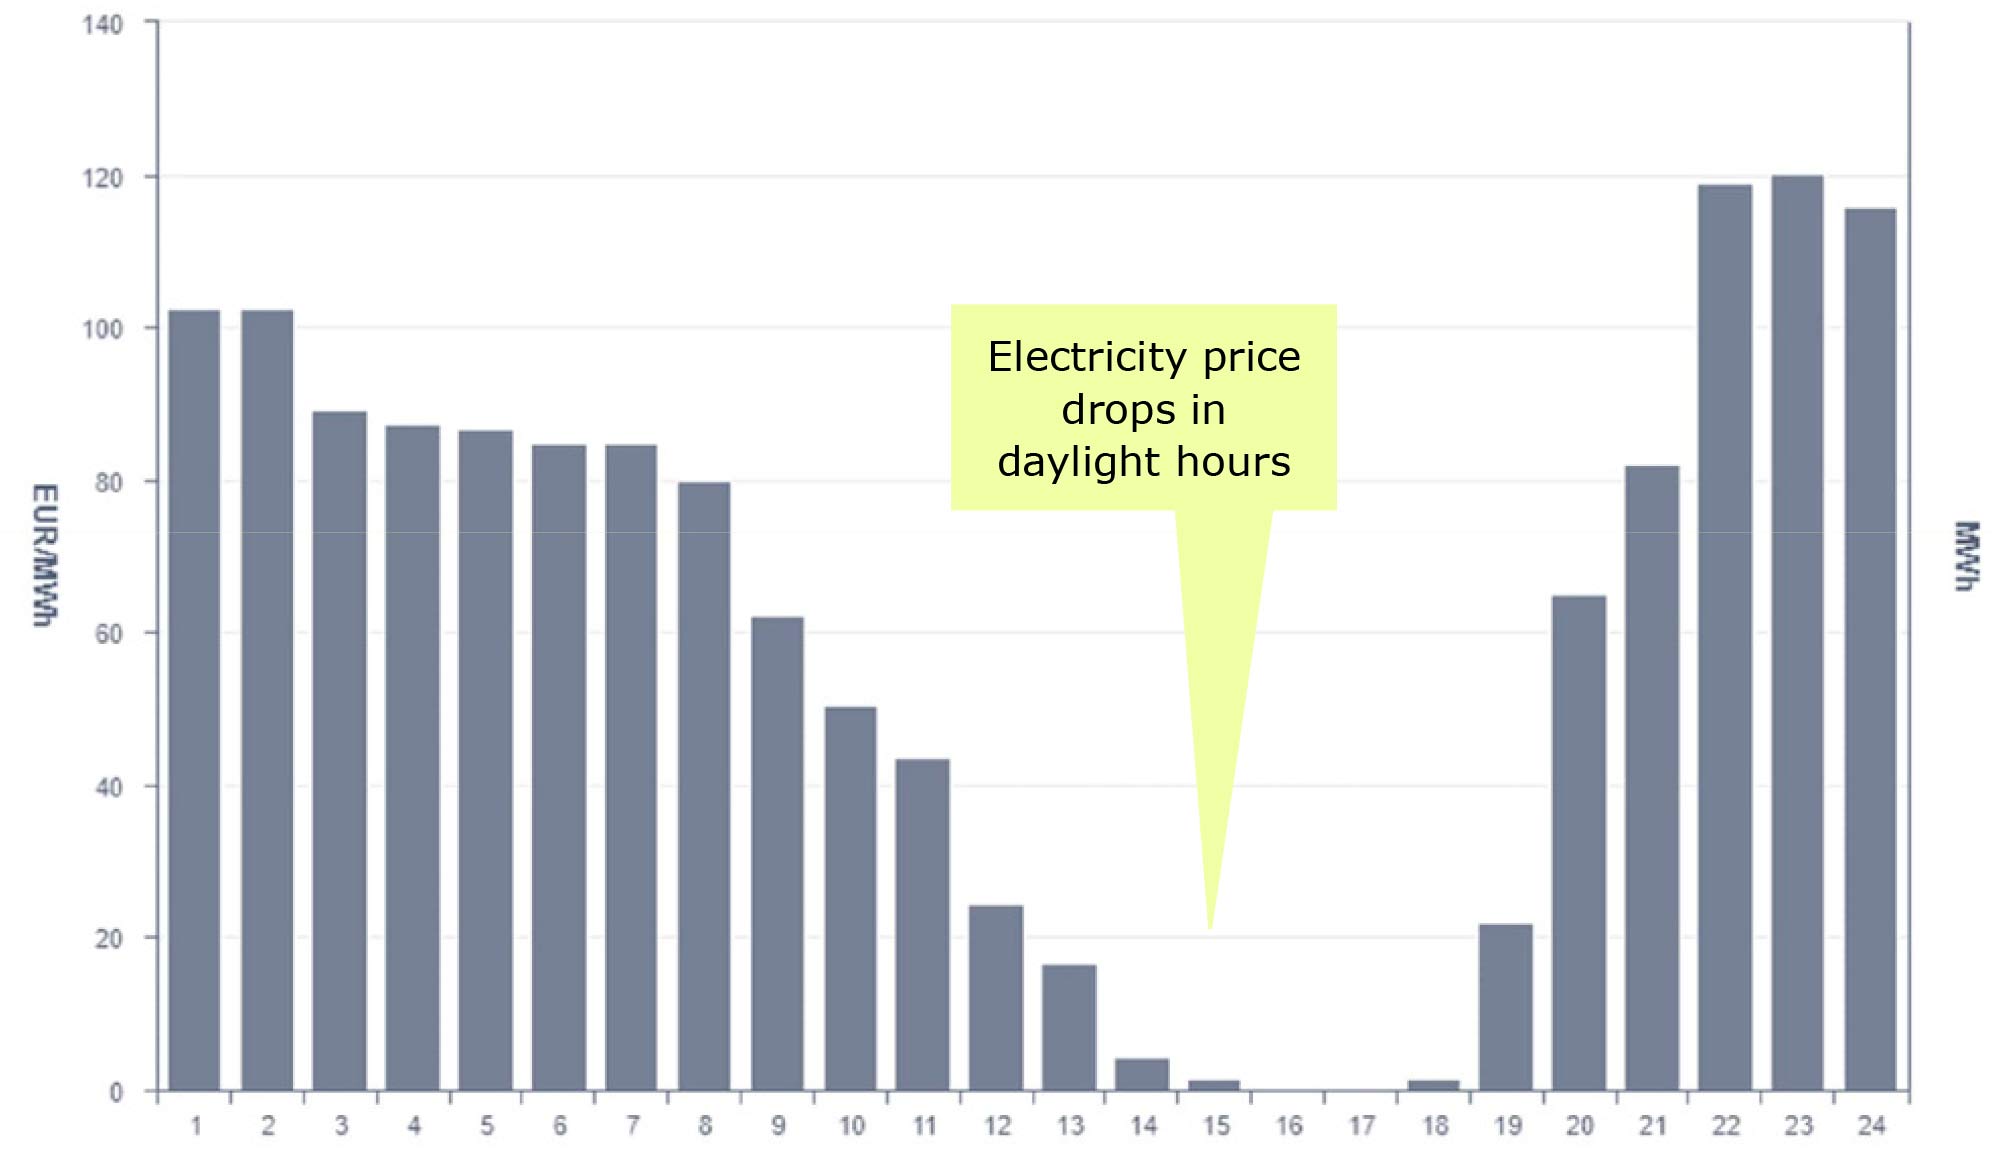
Any company that considers installing solar panels should bear in mind that they may start to produce electricity during hours when it is very cheap to buy from the grid. On this particular day, prices even drop to zero, as often happens during weekends. This shows that profitability should be simulated hourly, and not with long-term averages. Similarly, wind power generation also has correlation with grid electricity prices.
In the long term, as utility companies and end-consumers shift towards renewable energy, this correlation is expected to increase. With that in mind, in this article we will define the key concepts required to size and determine the optimal profitability of an energy decarbonisation project.
Sizing and determining the energy decarbonisation project
In order to correctly size an energy decarbonisation project there are some key inputs that are necessary:
1. Consumption modality. The consumer may have self-consumption with no electricity export to grid or not. This will be defined by local legislation and technical aspects of the installation.
2. Consumer consumption profile with hourly resolution. This should be obtained with historical data and projected considering any major changes (major CapEx investments, changes in production, etc).
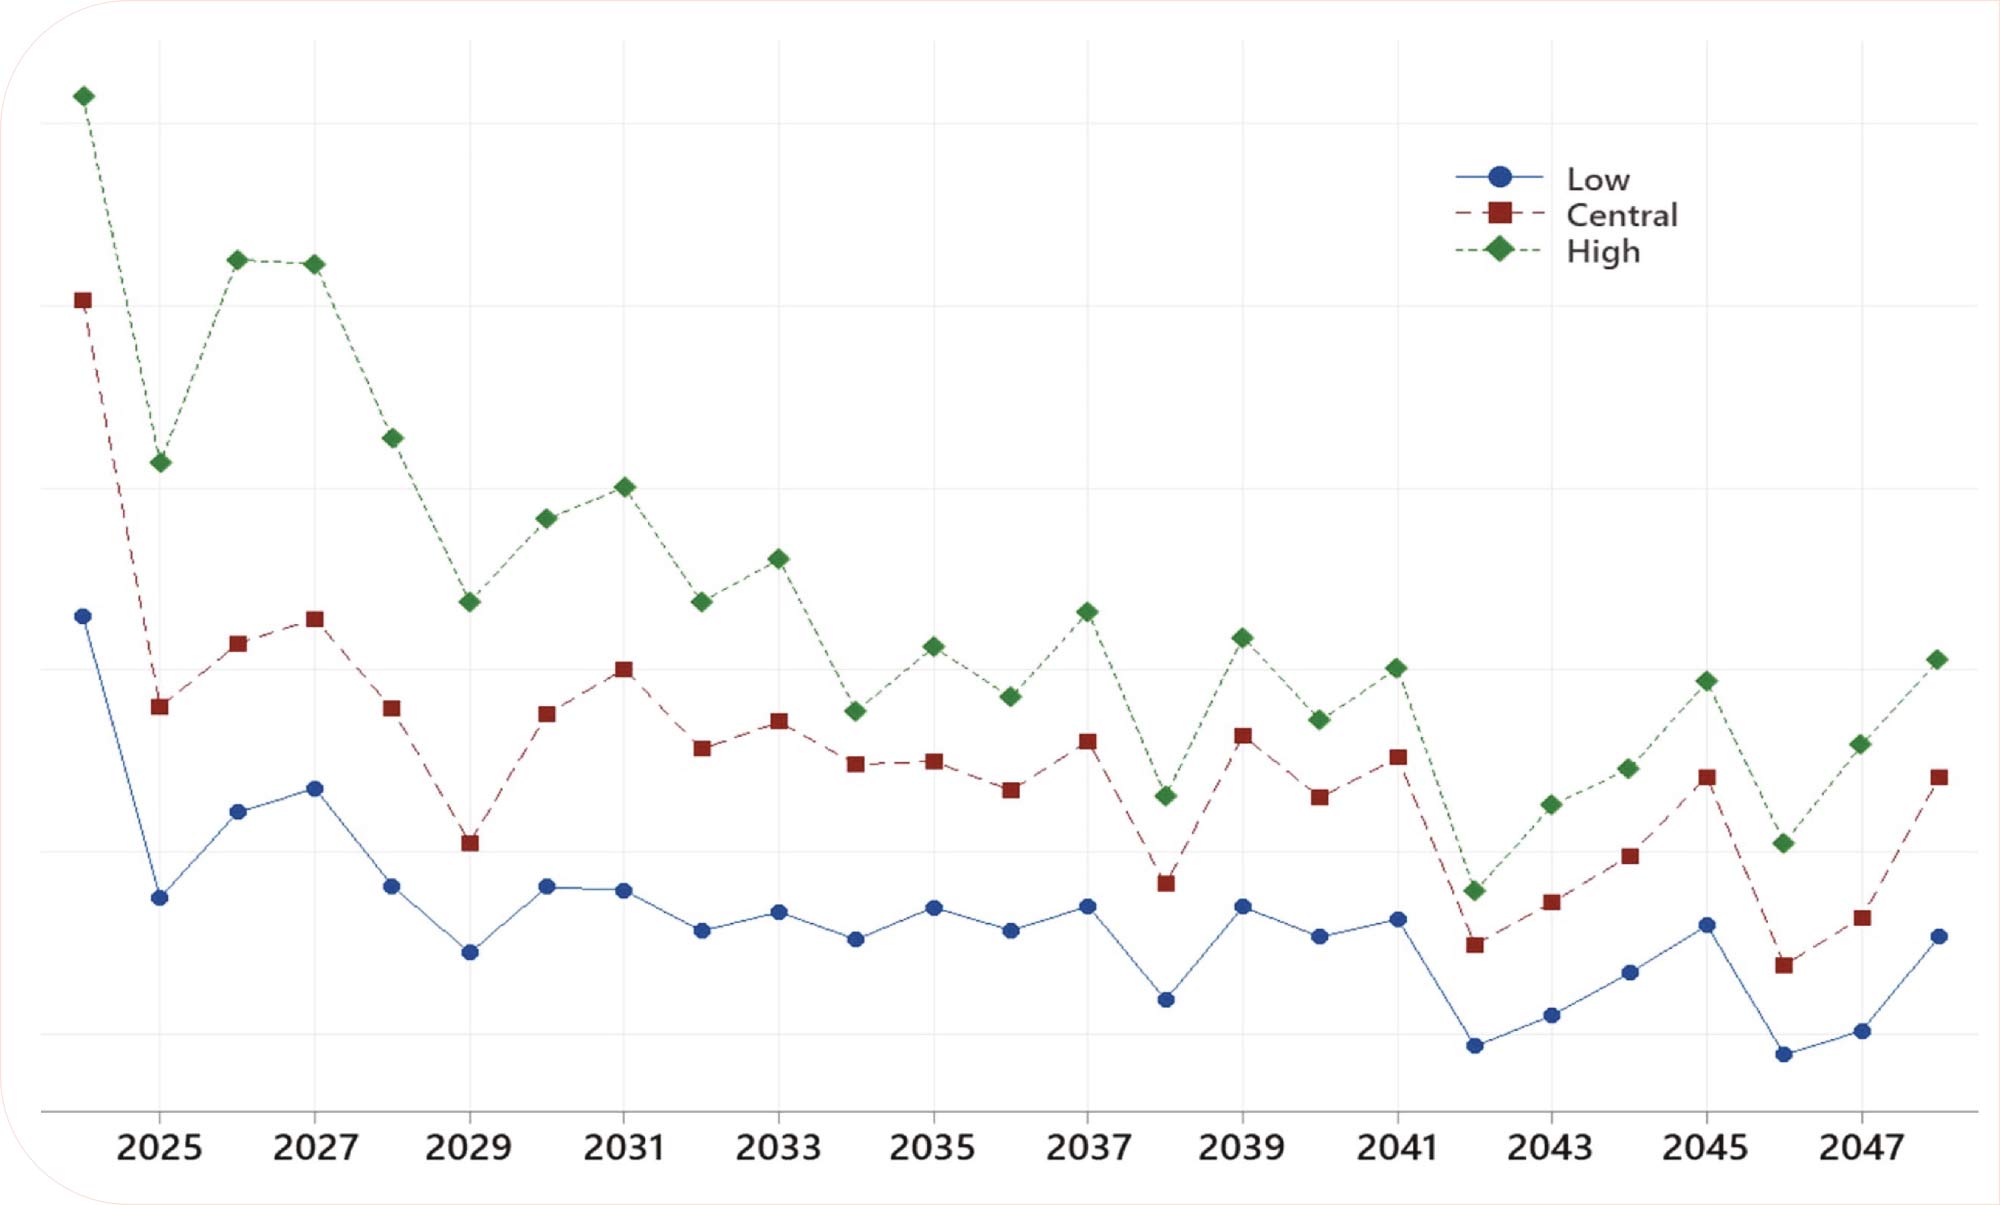
3. Electricity price hourly forecast. Complex modelling of hourly forecasts should be obtained using the generation mix, CO2 and gas price prediction, consumer consumption profiles, international connections, etc. These models must be built upon detailed hourly meteorological simulations, given the correlation previously mentioned. Three forecast scenarios should be considered (high central and low prices), as shown in Chart 3.
4. Local solar and wind generation historical data, which will be linked to the electricity price forecasts.
5. CapEx and OpEx for the solar and wind installations.
6. Financial assumptions, such as inflation, weighted average cost of capital (WACC), project duration, taxes, and others.
After key inputs are available, the simulation can be started. The simulation will consider the above inputs and will assess varying sizing and combinations of solar, wind power generation installation, as well as varying sizes of battery energy storage systems (BESS). This will reflect the hourly energy balance of the plant for the duration of the project (typically a 25-year forecast).
This example assesses the Levelised Cost of Electricity (LCOE), or the overall lifetime electricity price in €/kWh that the customer will obtain averaging their renewable energy generation and imports from the grid.
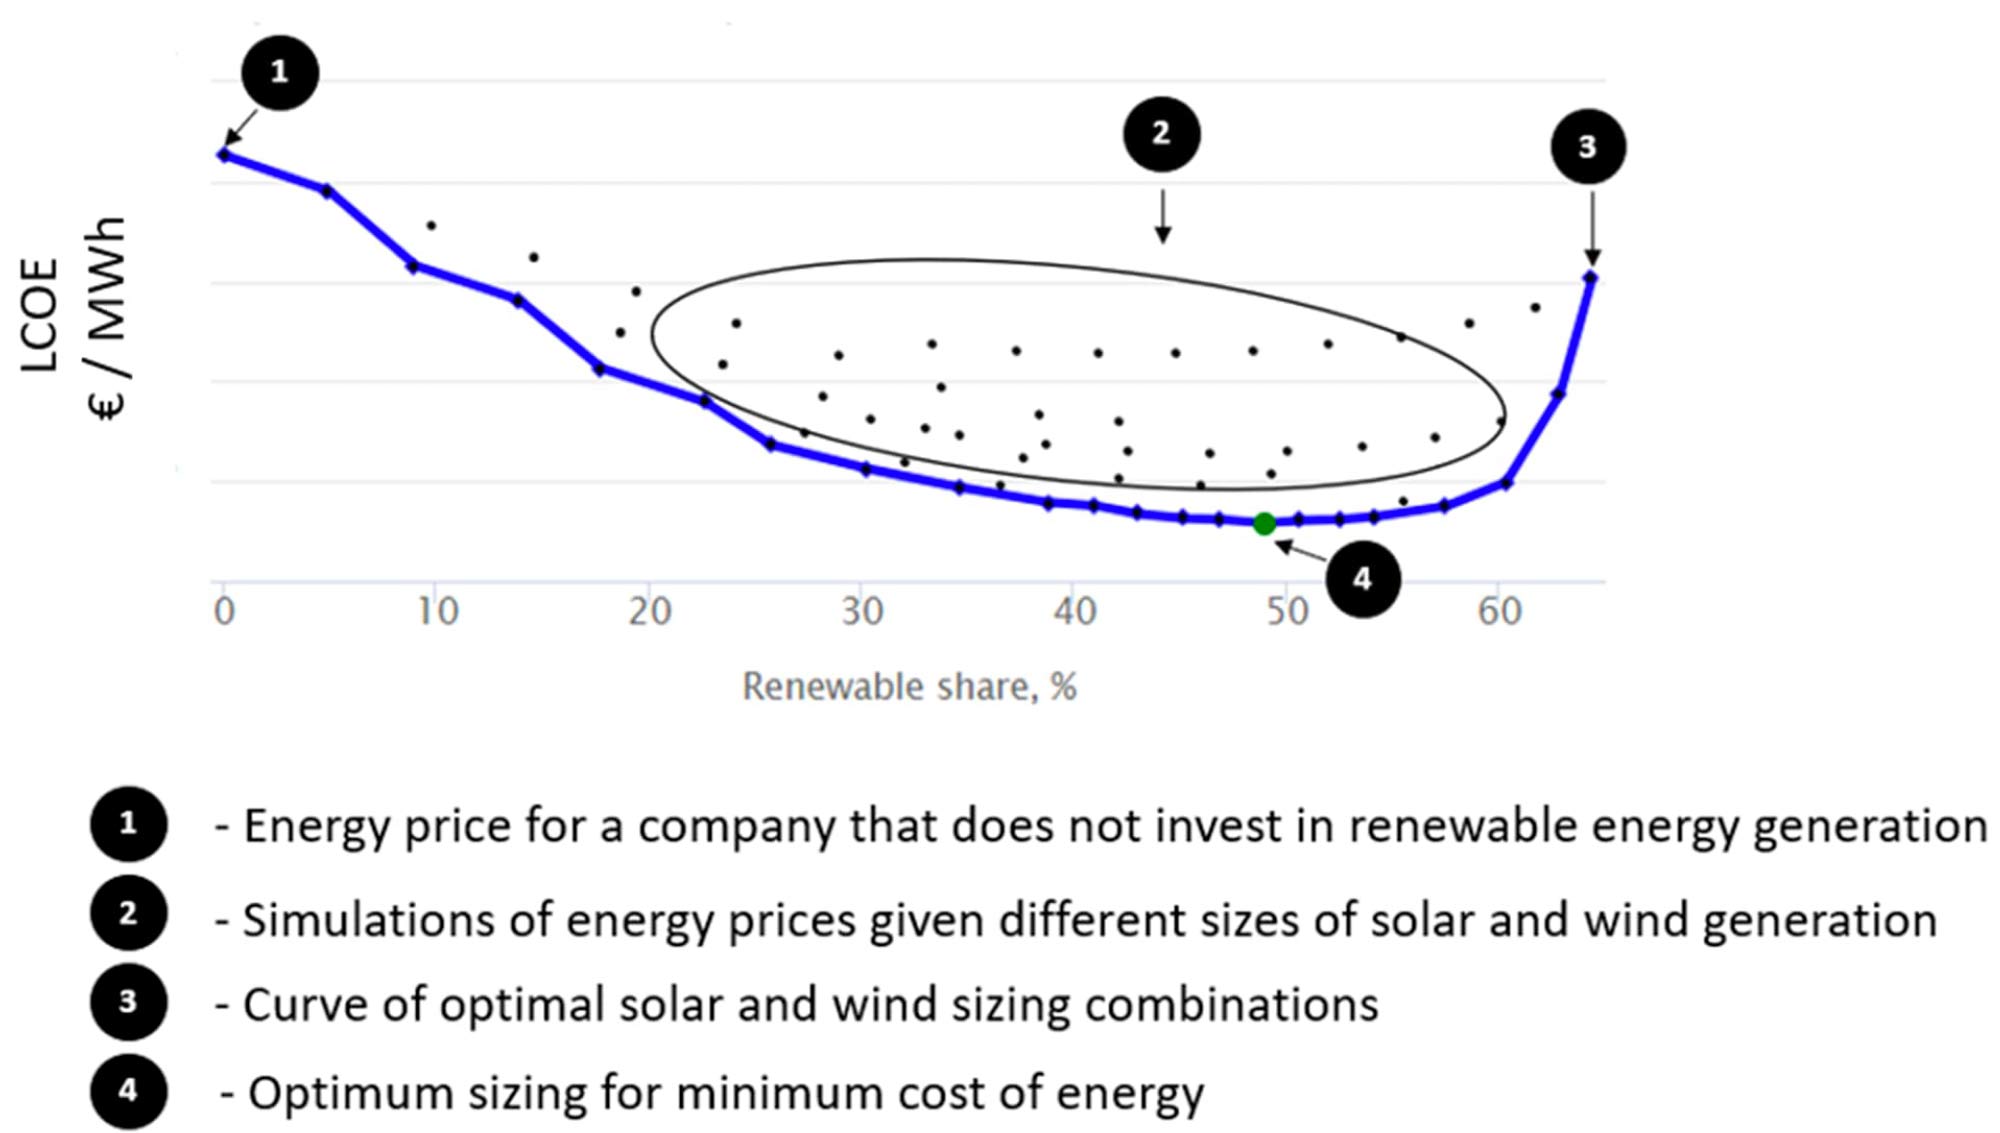
In Chart 4, it is seen that if the company does not invest in solar PV or wind power (0% renewable share), it will have an energy cost of point 1 over 25 years. In this example, several simulations are carried out using combinations of sizes of solar and wind power plants. Each black dot is the simulation of 25 years considering a sizing combination. The blue curve shows the optimal combinations, or most efficient sizing given a renewable share. The green dot (point 4) is the absolute optimum, showing the sizing of solar and wind that will give the lowest possible levelised cost of energy.
After a certain point, it does not make sense to increase the percentage of renewable share in the company. This is because excess energy is curtailed or sold at a low price to the grid. In scenarios where electricity is sold to the grid at a high price, the optimum renewable share could be higher.
Effect of cost of electricity
This simulation should be repeated for different electricity price scenarios. In scenarios where the price of electricity is forecast to be higher, the optimum sizing will be higher.
As seen on Chart 5, a high electricity price scenario will shift the share of renewable energy to a higher percentage. This is because even if some of the energy is curtailed, the added savings due to reduction of grid energy consumption will compensate these losses. Having all these considerations in mind, an analysis as to how best to optimise a company’s decarbonisation strategy can be made.
Decarbonisation strategy
Once the map of possibilities and optimal sizes is available through simulation, a company must make a choice that is sufficiently profitable whilst minimising risk. The following chart explains how to best approach this. In Chart 6, the following areas are defined:
1. No-investment LCOE range. This is the range of electricity cost that a company may observe in the next 25 years. That is, a company that has 0% renewable energy generation on-site will be fully exposed to grid electricity price variation.
2. Investment decision range. This considers the range of renewable share between low and high grid electricity price scenarios. For minimal LCOE, the company’s R.E. share should be sized within this range.
3. Investment tariff range. This is the rane of electricity tariff that a company may observe in the next 25 years, considering that it has a renewable share between the optimum for a low price and a high price scenario.
4. Low risk zone. This is the range of sizin for which a company will ensure that LCOE will stay under grid price. In scenarios where companies have a large renewable share, there is a risk that their LCOE will be above grid prices if they drop. By staying within the low-risk range, this risk is minimal.
5. Opportunity-risk. Companies that have a low renewable share may miss the opportunity to lower costs further.
An important note – know your objectives!
This study has been focussed on a sizing for minimum LCOE. Similarly, this study could have been carried out for maximising profits or minimising CO2 emissions. The same concepts are applicable, but optimal sizing will differ depending on the company’s targets.
Conclusions
Investing in renewable energy generation for self-consumption is a good opportunity for decreasing cost and carbon footprint of companies. However, sizing must be calculated very carefully. The company’s consumption profile, energy markets, weather patterns must all be considered, and simulated on an hourly basis.
Once available, this information should be used for making a decision that provides good profitability at a risk that is understood and in line with the company’s strategy.


