


Changing fibre prices, exchange rates, and environmental regulations present some participants advantages, new challenges, as well as opportunities.
Report by Bruce Janda, Senior Consultant, Fisher International.

Latin America is defined more by a shared Latin culture than strict geographical boundaries. In our previous column for the Nov/Dec TWM, our focus was directed towards Brazil as the singular Portuguese-speaking section. This leaves a predominantly Spanish speaking range from Mexico in North America to Chile, facing Antarctica for purposes of this report. Several smaller countries use French, Dutch, or English as their official languages. It’s essential to note that Hispanic culture is not uniform, with significant variations in food, music, and societal aspects across countries. All of these factors should be expected to influence tissue demand.
Figure 1 shows a map of the Americas with a heatmap for Latin American tissue production. Brazil was included on the map as a reference to the previous report. Mexico and Brazil, coloured red, show as the largest producers, followed by Colombia and Argentina. Figure 7 also shows Latin American tissue production in a pie chart, ranking the relative production volumes without Brazil. Cuba, the Dominican Republic, and Trinidad & Tobago are identified tissue producers in the ResourceWise database.
Given the many small islands, determining the countries included in Latin America for economic and trade statistics poses a challenge. A comprehensive overview of economic indicators influencing or impeding the development of tissue consumption is depicted in Figure 2, showcasing the trend in Latin American population and GDP growth.
Excluding Brazil, the Latin American population exceeds that of Brazil by more than twice. The blue line representing the average GDP per capita shows significant disruptions during the Covid-19 pandemic. While the average consumer purchasing power aligns with Brazil’s, this average hides a lot of variation in income levels. Climate change affecting agriculture combined with economic and political disruption has driven migration to North America, resulting in instability that continues to frustrate tissue consumption development. The economic headwinds on tissue consumption growth are shown in Figure 2. The average unemployment trend appears reasonable but hides several significant outliers. The average inflation peaked at 2,100% in 2018 and is arithmetically correct, but the massive impact of several countries’ runaway inflation distorts the average. Any tissue demand study must consider the different consumer conditions in neighbouring countries.


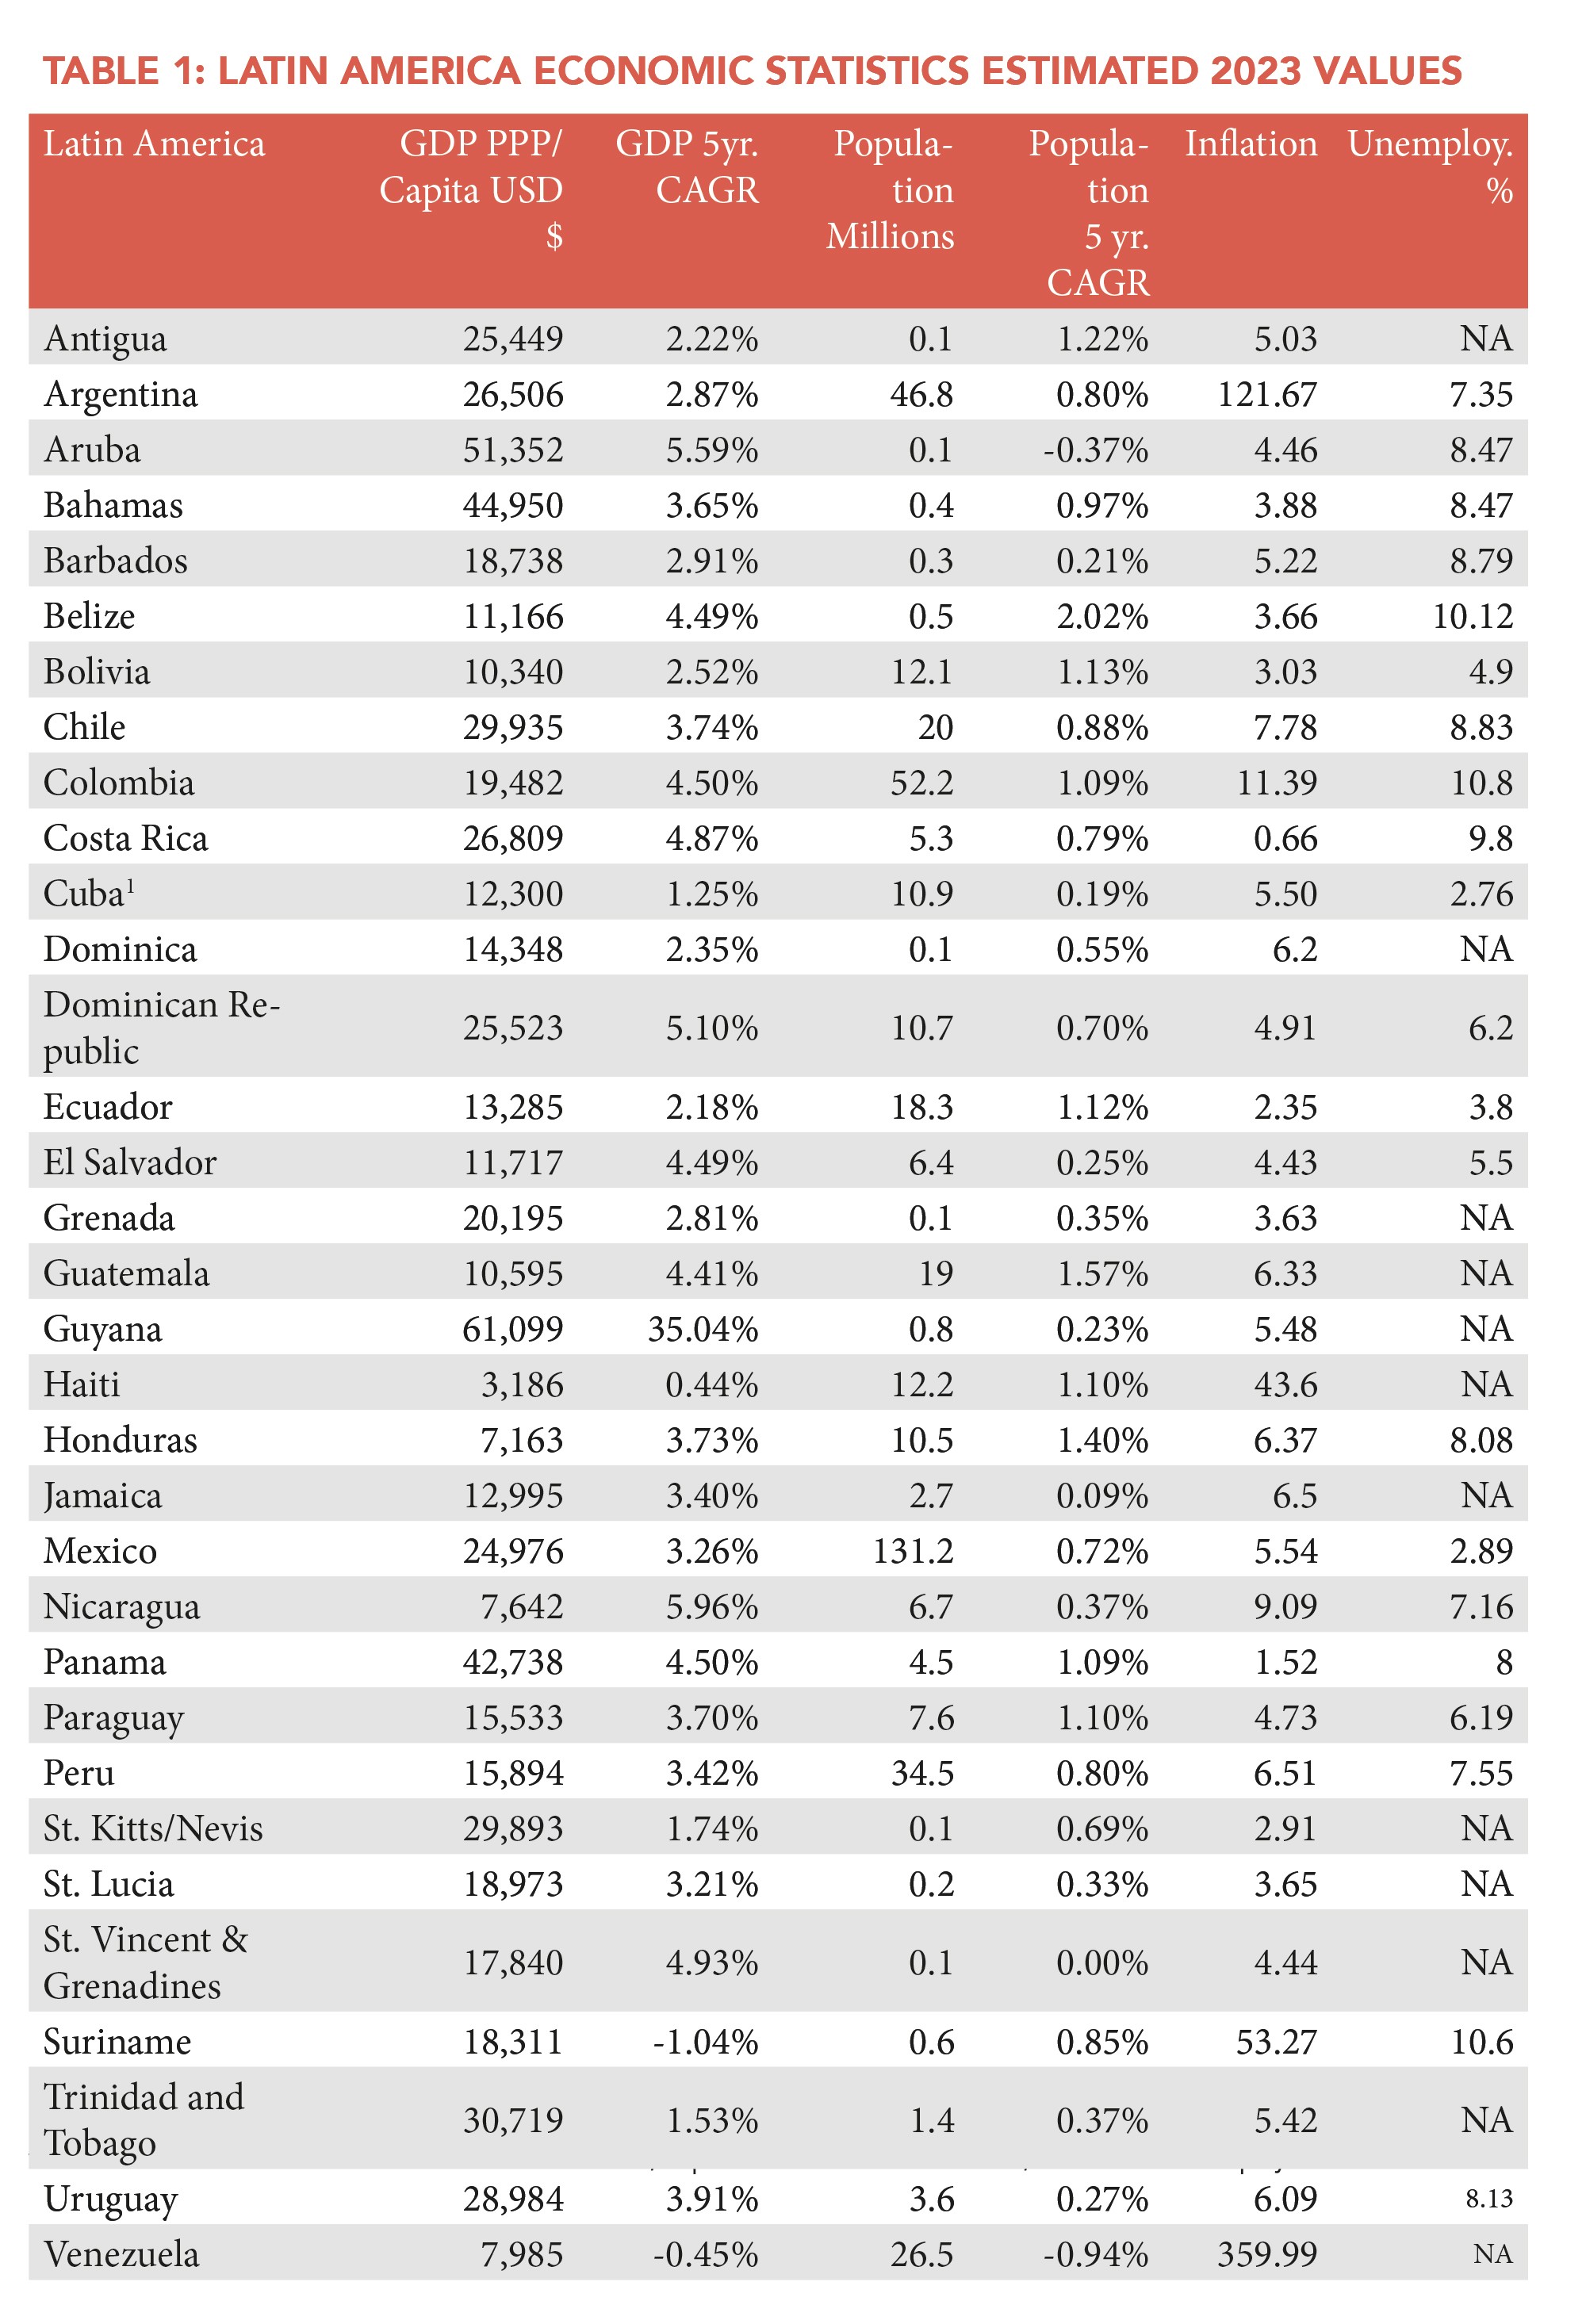
These regional averages offer limited guidance, so the individual country’s economic statistics are also shown in Table 1. The FisherSolve economic and trade databases encompass the Latin American countries featured in the report, with the exception of Cuba. Although tissue production data for Cuba is available in other sections of this report, the economic data is taken from the World Factbook (www.cia.gov/the-world-factbook/countries/cuba/). The five-year compound annual growth rate (CAGR) is included for both income and population growth.
The inflation numbers for Argentina, Haiti, Suriname, and Venezuela are highlighted in bold. Venezuelan inflation at 359.99% in 2023 is much lower than in previous years, which was distorting Figure 3. Most other countries are doing fine with inflation. Haiti has a very low personal income. Other low-income countries are Honduras, Nicaragua, and Venezuela. Countries like Aruba, the Bahamas, and Guyana would be considered rich. Guyana stands out with recent income growth.
The tissue import trend to the Latin American region is shown in Figure 4, and the tissue export trend is shown in Figure 5. This import and export data considers Brazil as an external source or destination. Tissue imports and exports are roughly in balance for Latin America. Most tissue imports come from within Latin America or from North America (Canada and US). The same can be said for exports, but a trend toward more tissue from the Asia-Pacific region has recently developed. With tissue imports and exports roughly balanced, the expansion of tissue supply depends on local tissue machine capacity and capability development. Figure 6 depicts the fluctuation trend in the addition and removal of tissue machines within the Latin American tissue machine fleet.
From 2007-2025, a net increase of approximately 45 machines is anticipated. However, only about 18 old machines were removed during this period, a number lower than what would be expected in a healthy system. The newly added machines have significantly greater capacity than the old ones remaining or removed. Several countries have made significant increases in their tissue capacity during 2007-2025. Bolivia, for example, experienced a CAGR of almost 16%, Guatemala was slightly under 9%, and Peru saw growth of less than 8%.
Relative tissue capacity by country is shown in Figure 7. Mexico’s tissue is just slightly smaller than Brazil’s, but its capacity is three-four times that of Argentina’s as the next largest producer in Latin America. Some countries, such as Venezuela, appear to be shrinking in tissue capacity.
Latin American tissue mill sites are mostly integrated with recycled fibre, as shown in Figure 8. Virgin fibre integration is minimal compared to North America or even Brazil. Unsurprisingly, recycled integrated sites mostly use recovered papers in deinked bleached, unbleached, and unbleached not-deinked processes. Eucalyptus hardwood is the primary virgin pulp source, followed by southern softwood.
Latin American tissue production broken down by finished product format is seen in Figure 10. Consumer bath tissue comprises 61% of the total output, followed by 14% production in consumer towels. Growing more tissue consumption requires increasing towel use in the home. The instability of the region appears to deter this growth. Latin America has experienced a slight adoption of advanced tissue technology. While Colombia has some advanced capacity, Mexico is much more like the rest of North America in the deployment of advanced tissue machines of several classes. Mexico’s development is supported by the trade partnerships with Canada, the US, and the Mexico City urban market for advanced tissue products.
The average quality of Latin America’s tissue fleet by countries is shown in Figure 12. This chart plots the average technical age of the machines on the X-axis against the average speed on the Y-axis. The size of each country’s bubble represents its total tissue capacity. The most recently expanding capacity in Bolivia, Guatemala, and Peru has resulted in relatively up-to-date machines, but only Guatemala has average speeds above Mexico. Argentina has been modernising recently, while Mexico appears to have slowed new capacity.
The relative average cost of making a finished ton of tissue for the Latin American countries is shown in Figure 13. Brazil was added back into this analysis to support local comparison. The height of each country’s bar represents the cash cost of production, and the width of each bar is the relative tissue capacity. The coloured bands for each bar represent the costs of raw fibre material, market pulp, chemicals, energy, labour, materials, overhead, and credits. Venezuela and Argentina have the lowest cost set, but their very high inflation rates can make direct cost comparisons problematic at any point in time. Conversely, Mexico has relatively high energy costs compared to most of Latin America. These are average costs, and individual machine costs will diverge considerably.
A snapshot of the average tissue machine and mill viability is shown in Figure 14. In this case, the cost of the bar height is detailed by viability factors, where cost is only one of the factors. The legend shows these factors as capital required, cost, grade risk, internal company risk, competitiveness, size, technical age, and tons per unit trim. Most countries do well in this comparison, positioned at the lower end of this set. However, El Salvador, Venezuela, Uruguay, the Dominican Republic, Ecuador, and Panama are in the high-risk group with lower viability.
Figure 15 displays carbon emissions per finished metric ton, specifically focusing on emissions from tissue machines on-site and excluding pulp production at integrated sites. Scope 1 and 2 emissions were chosen as they are most likely to be included in a carbon analysis by potential consumers. The colours stacked in each bar represent the source of each emission. The two key areas are fossil fuel consumption on-site for power and heat during tissue drying, as well as the fossil fuel content of electricity grid production.
Uruguay and Brazil exhibit the best results in this chart. Trinidad and Tobago, Panama, and the Dominican Republic fare less favourably. Carbon emissions are influenced not only by the type of electric grid power or mill heat source, ranging from coal to natural gas, but also by the energy efficiency of each machine in producing the same ton of tissue.
Latin America maintains a relatively balanced trade position, with most imports and exports occurring within the region or with North America. Notably, there is a rising trend in imports from Asia. While the installation of new machines and technology is underway, the removal of old machines seems to be occurring at a lower rate. The diverse economic and political disruptions specific to several countries pose challenges in comparing costs and hinder the development of regional tissue markets and increased consumer demand.
Analysis of competitive position requires specifics on tissue producers and individual machines. This article presents a static summary of Latin America’s tissue industry today. The region’s tissue mills will continue to change hands and consolidate, and neighbouring countries may invest in tissue-making capacity, affecting Latin America’s imports and exports.


