


By Bill Burns, Senior Consultant, Fisher International


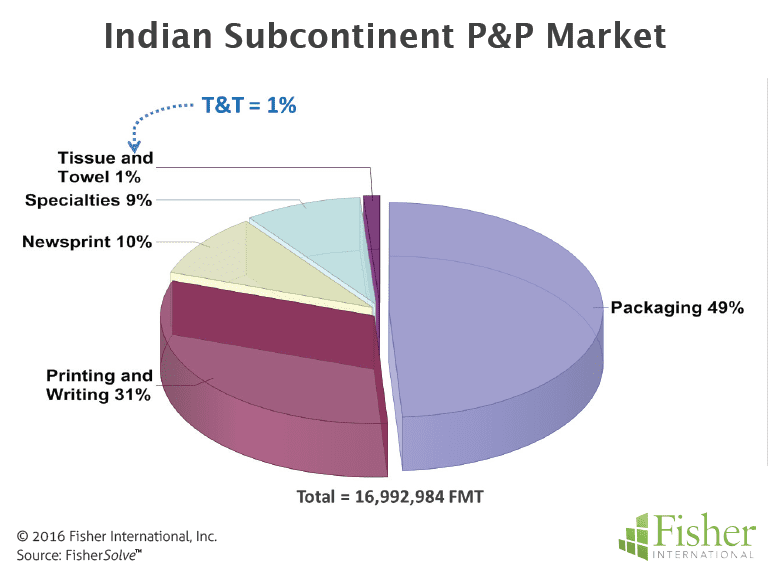


The second most populous nation in the world, India is ranked fifth in a worldwide listing of countries producing paper products. With a population of 1.25 billion, one would expect India to have significant capacity in Towel and Tissue (T&T) production. In actuality, it has a very modest T&T capacity base. India produces about 15.5 million metric tonnes of paper annually (Figure 1) but only one percent, 141 thousand tonnes, are T&T products placing the country 40th in a worldwide T&T ranking. By contrast, India ranks sixth and seventh when it comes to packaging, printing and writing, respectively.
The question is why isn’t there a higher concentration of T&T in India? Is it general economic conditions, ability to compete with other areas or regional suppliers, or cultural norms? The country’s GDP is estimated around $8 trillion with a growth rate of 7.3%, which makes it the fourteenth fastest growing economy in the world. The strength of the economy does not appear to be suppressing the growth of T&T in this otherwise robust paper producing country.
The country’s GDP is estimated around $8 trillion with a growth rate of 7.3%, which makes it the fourteenth fastest growing economy in the world. The strength of the economy does not appear to be suppressing the growth of T&T in this otherwise robust paper producing country.
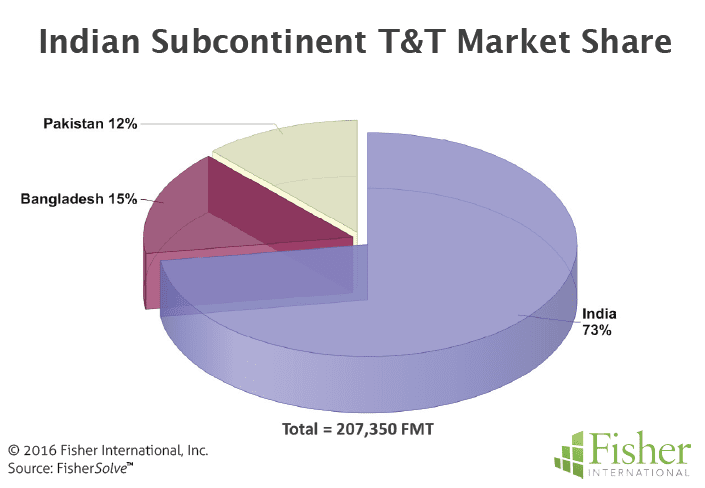
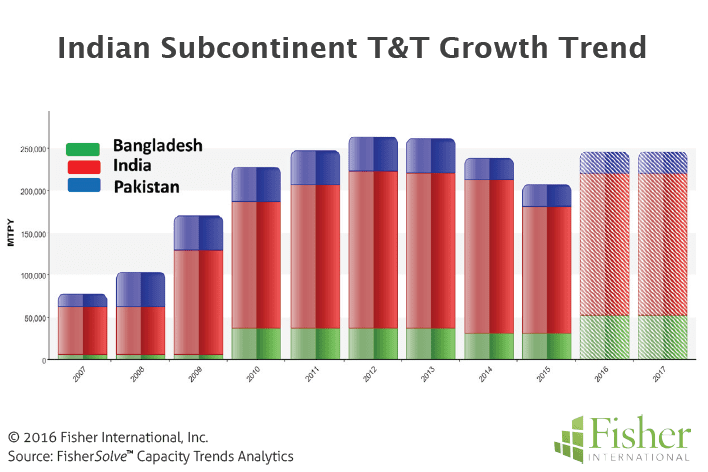
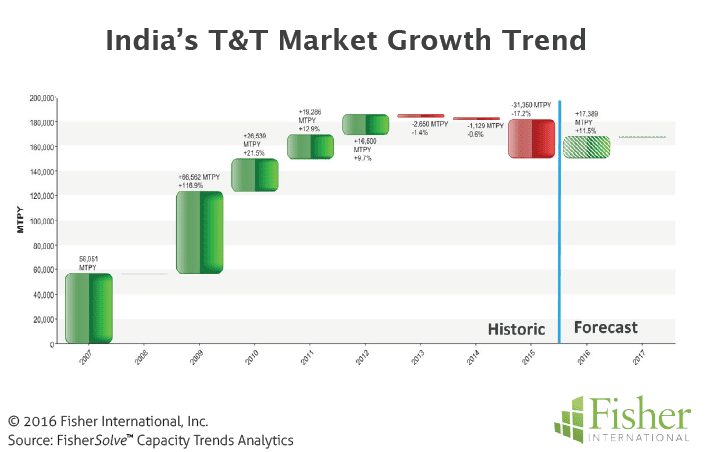
Regionally, papermaking in the Indian Subcontinent (India, Pakistan, and Bangladesh) has a similar grade distribution as India (Figure 2) with T&T representing only 1% of the paper capacity. It is noteworthy that paper production in the Indian Subcontinent is heavily influenced by India’s more than 70% share (Figure 3). Even with the country being the predominant paper producer in the area, it is not unreasonable to assume lower cost neighbouring countries suppressing the development of T&T in India (demographically, the country has 77% of the total population among the three papermaking countries). An analysis of the Indian Subcontinent’s T&T growth trend does indicate a dynamic market with a lift in capacity leading into 2011. Growth appears to have peaked in 2012 and has actually fallen some in 2015 (Figure 4). India, representing the bulk of the market, appears to set the area trend (Figure 5). There is little announced capacity increases in the area or the country. Consequently it appears the growth trend will be flat for the next few years.
If it is not due to economic conditions or area competition, that leaves just cultural norms as the reason the T&T market is suppressed when compared with other paper producing countries. An investigation into usage practices that would impact towel and tissue consumption provides good insight as to why the market is slow to develop. Personal preferences are heavily weighted to the use of water as a cleansing medium. Even in urban settings where squatting facilities have been traded in for western-style commodes, it is not uncommon to have flush toilets retrofitted with personal cleansing techniques reliant on water rather than paper, which is rejected by many as unhygienic.
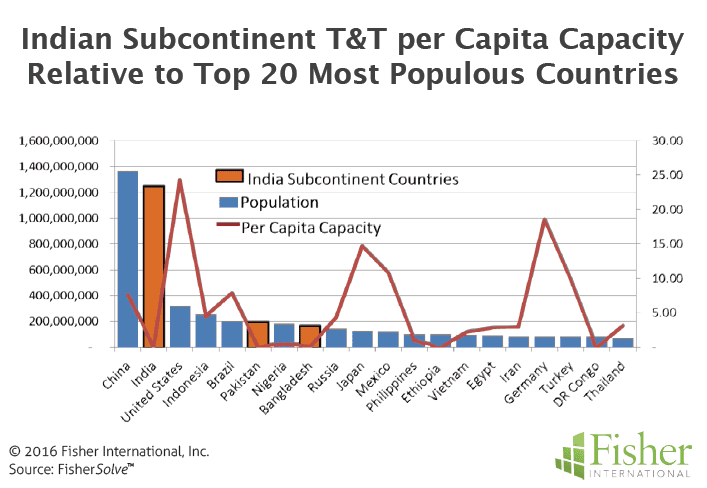
Looking at capacity versus population, we see that the Indian Subcontinent has the lowest per-capita capacity relative to many other populous countries (Figure 6). Indeed, per-capita capacity is akin to countries with the very lowest ratios like Ethiopia and the DR Congo. The contrast with countries with high per-capita numbers like Germany, Japan and United States is dramatic. Any significant change in the foreseeable future is questionable. Not only would the culture need to change but the infrastructure needed to accommodate a paperbased process would also need to be put in place.
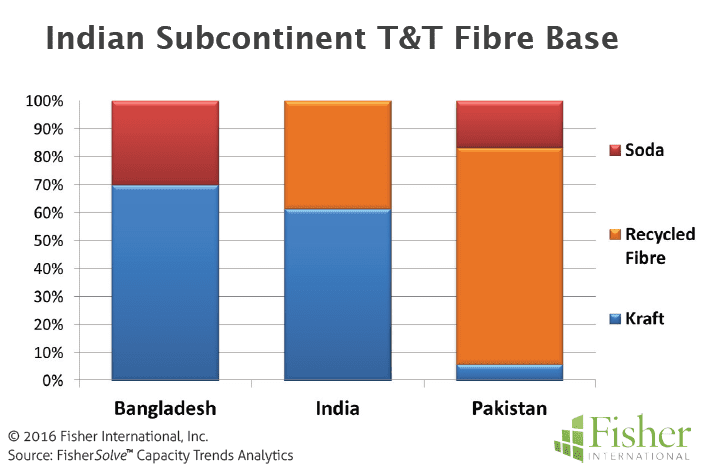
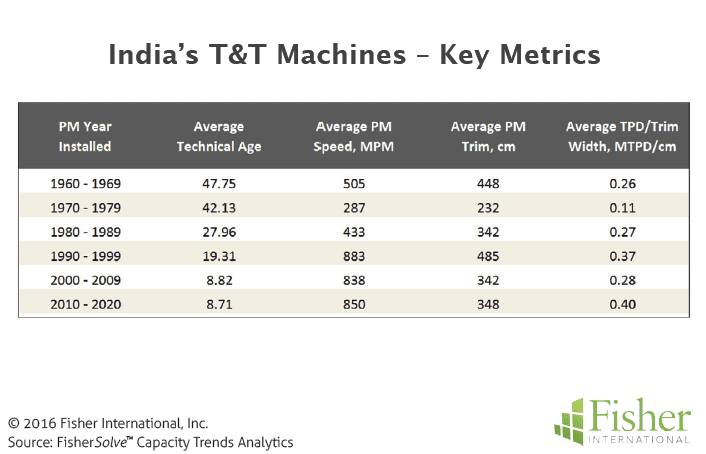
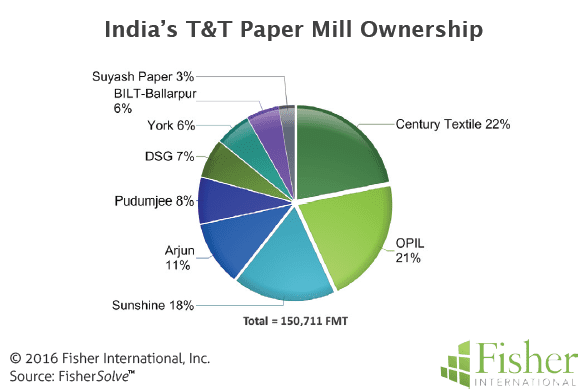
The remainder of this article will concentrate on the make-up and local competitiveness of India’s T&T operations. The fibre base of the three Indian Subcontinent countries varies widely. India is a 60/40 mix of Kraft and Recycle pulp (Figure 7). Interestingly, Bangladesh is all virgin pulp and Pakistan is almost exclusively recycled. As we will see later, India has a cost advantage with its mix. Its T&T machines can be characterised as small and slow (less than 500mpm) to modest (less than 900mpm) speed machines with three metre class widths. Install dates go back to 1960’s with two machines being added since 2000 (Figure 8). Mill ownership is entirely national with three of the nine companies representing 60% of the capacity (Figure 9).
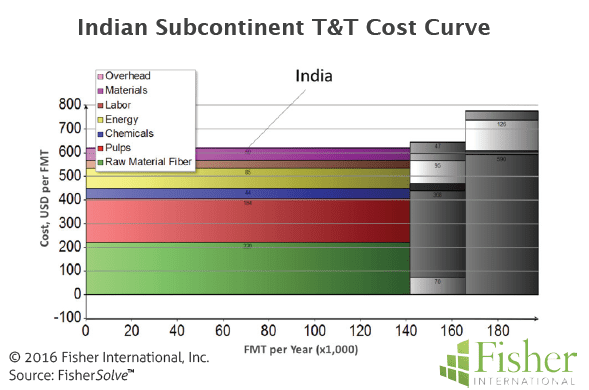
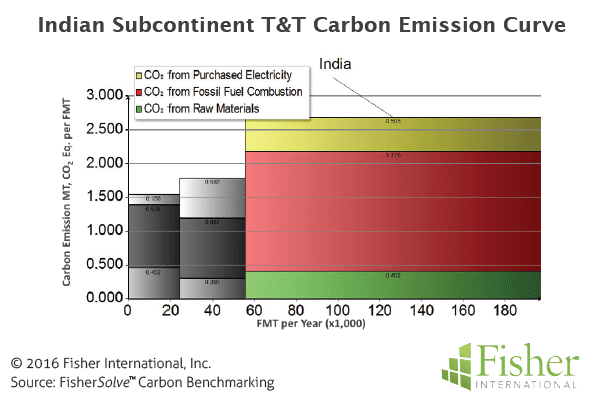
A T&T cost curve for the Indian Subcontinent shows India holding the most desirable cost position (Figure 10), driven primarily by fibre. Looking at today’s cost may be short sighted in considering overall and over time competitiveness. Carbon mitigation could represent a real future risk as climate change forces carbon reduction by heavy emitters. In this regard, India has a high exposure due to reliance on coal as a fuel. Within the area, India has a significantly higher carbon profile than the other countries (Figure 11). On a larger stage India is fourth quartile and has one of the highest carbon profiles among T&T producing countries worldwide. Over time, this GHG emissions vulnerability can be expected to absorb capital for either emission containment or for investment to change fuels and its concomitant consumption costs. Either of these alternatives will drive some additional cost into the paper.
The source for market data and analysis in this article is FisherSolve™. Data tables behind Figures 1 – 11 can be obtained from Fisher International. Email requests to [email protected].


