


By Bill Burns, Senior consultant, Fisher International

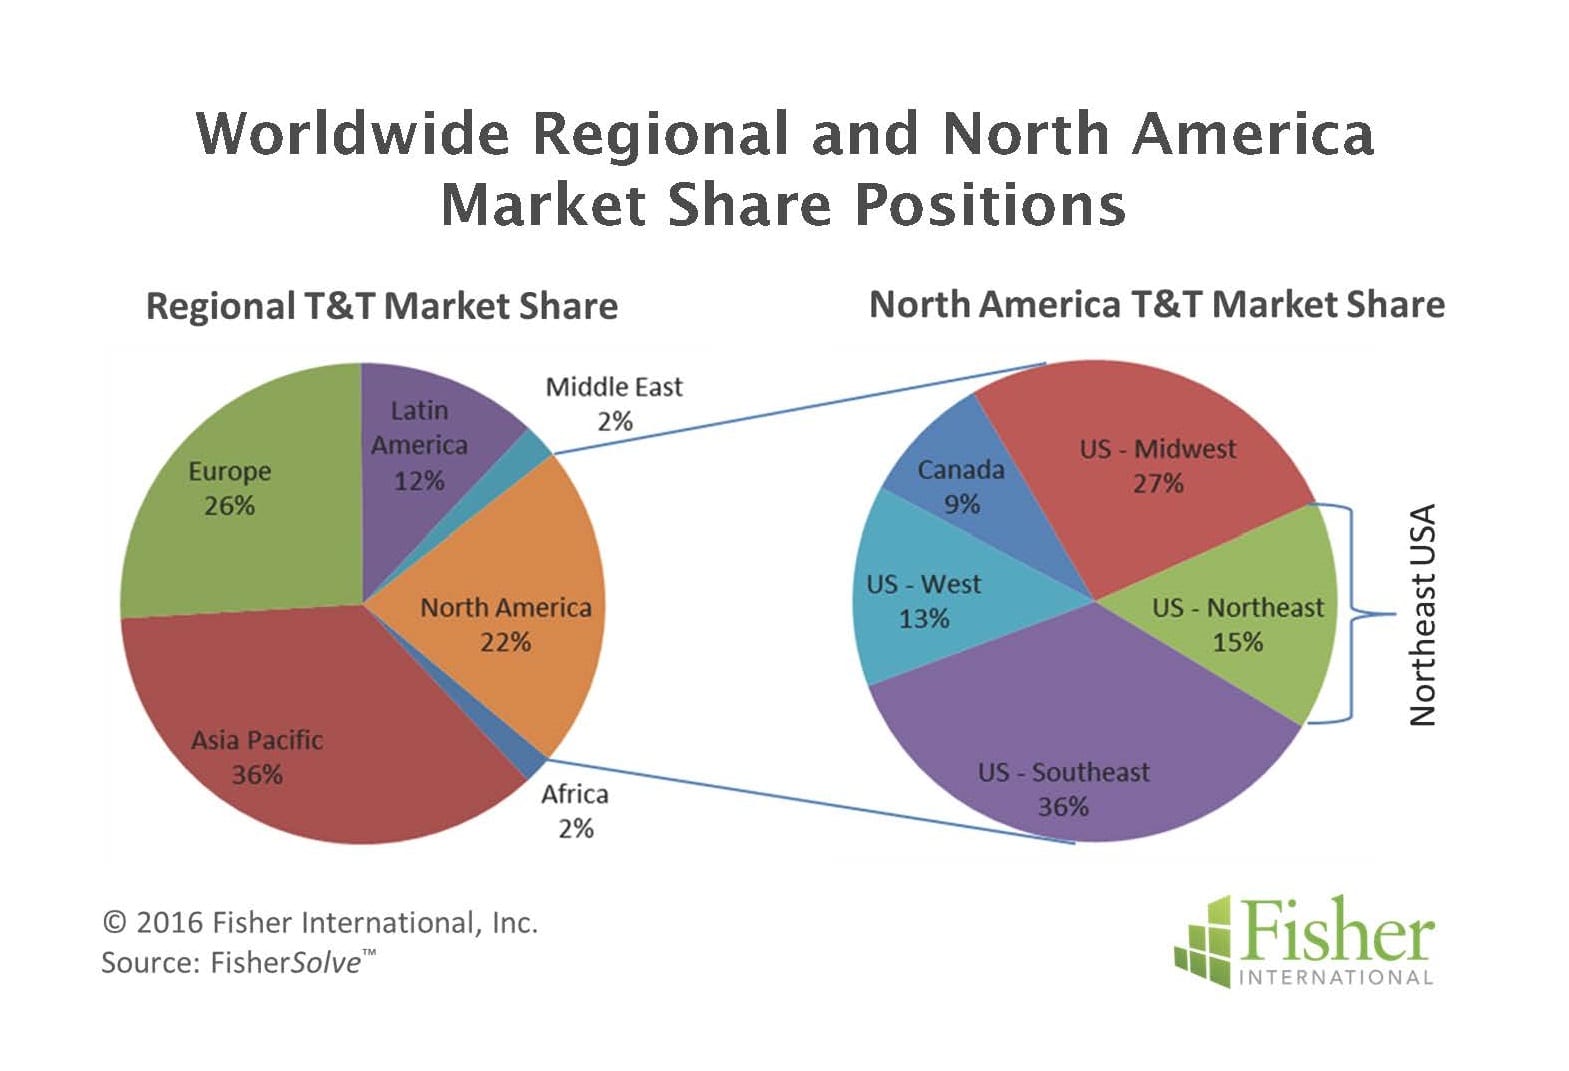


The global Towel and Tissue (T&T) market can be divided into six regions where North America ranks third with 22% of overall capacity. North American capacity can be further broken down into four regions in the United States plus Canada. Among these five T&T producing areas, Northeast US, with 15% of the region’s population, also represents 15% of North America’s capacity (Figure 1).
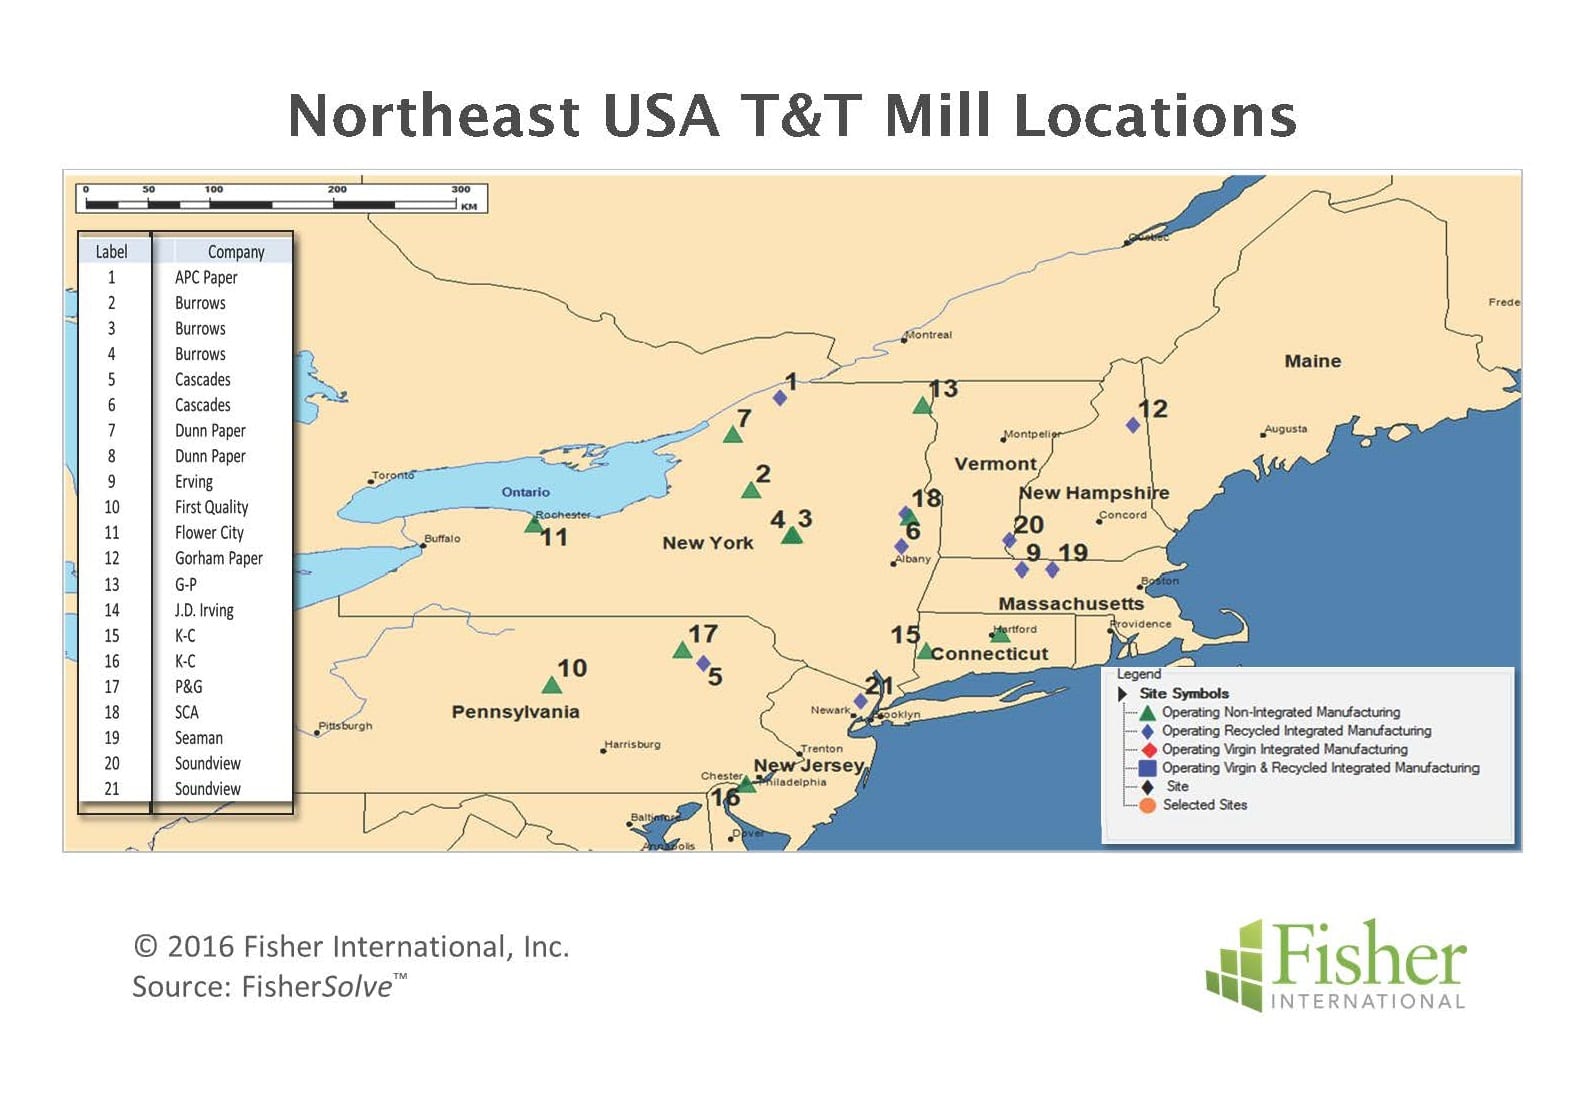
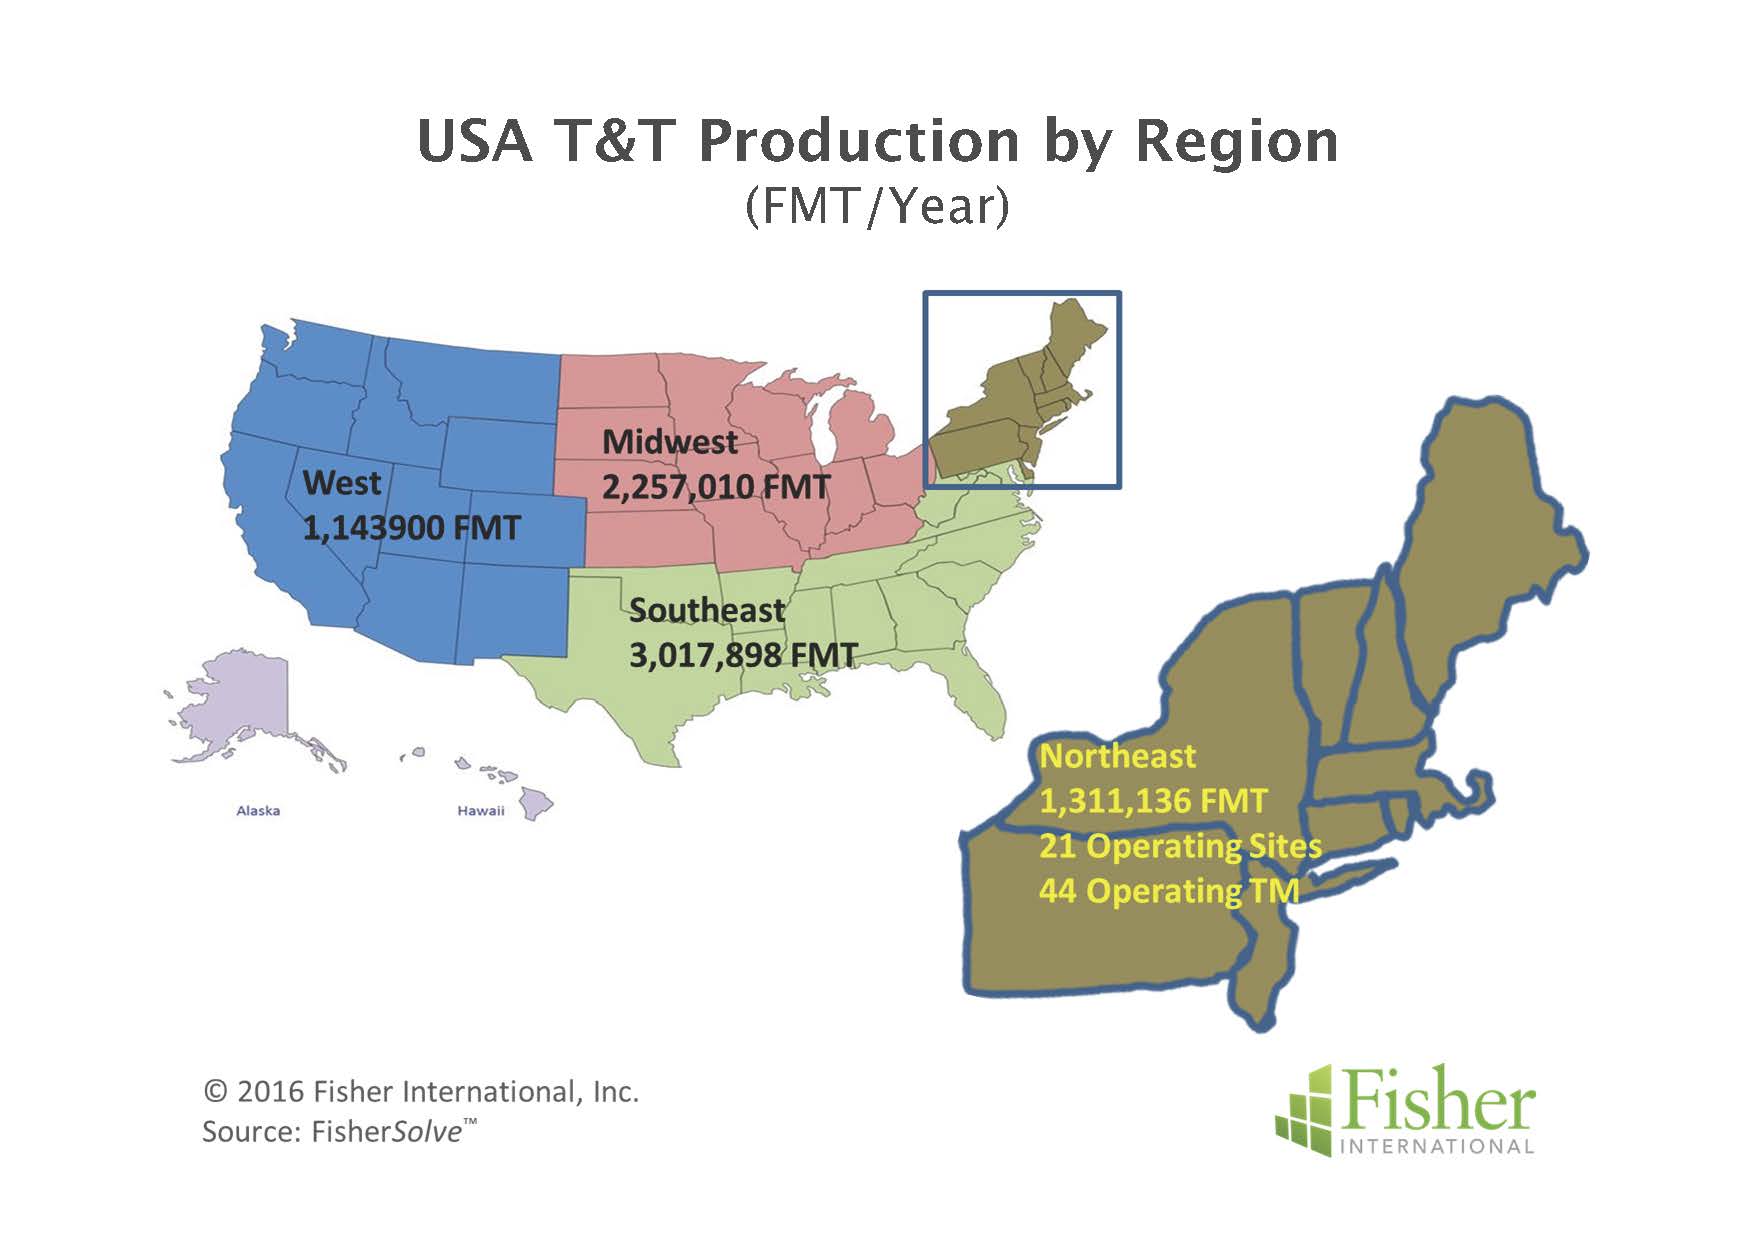
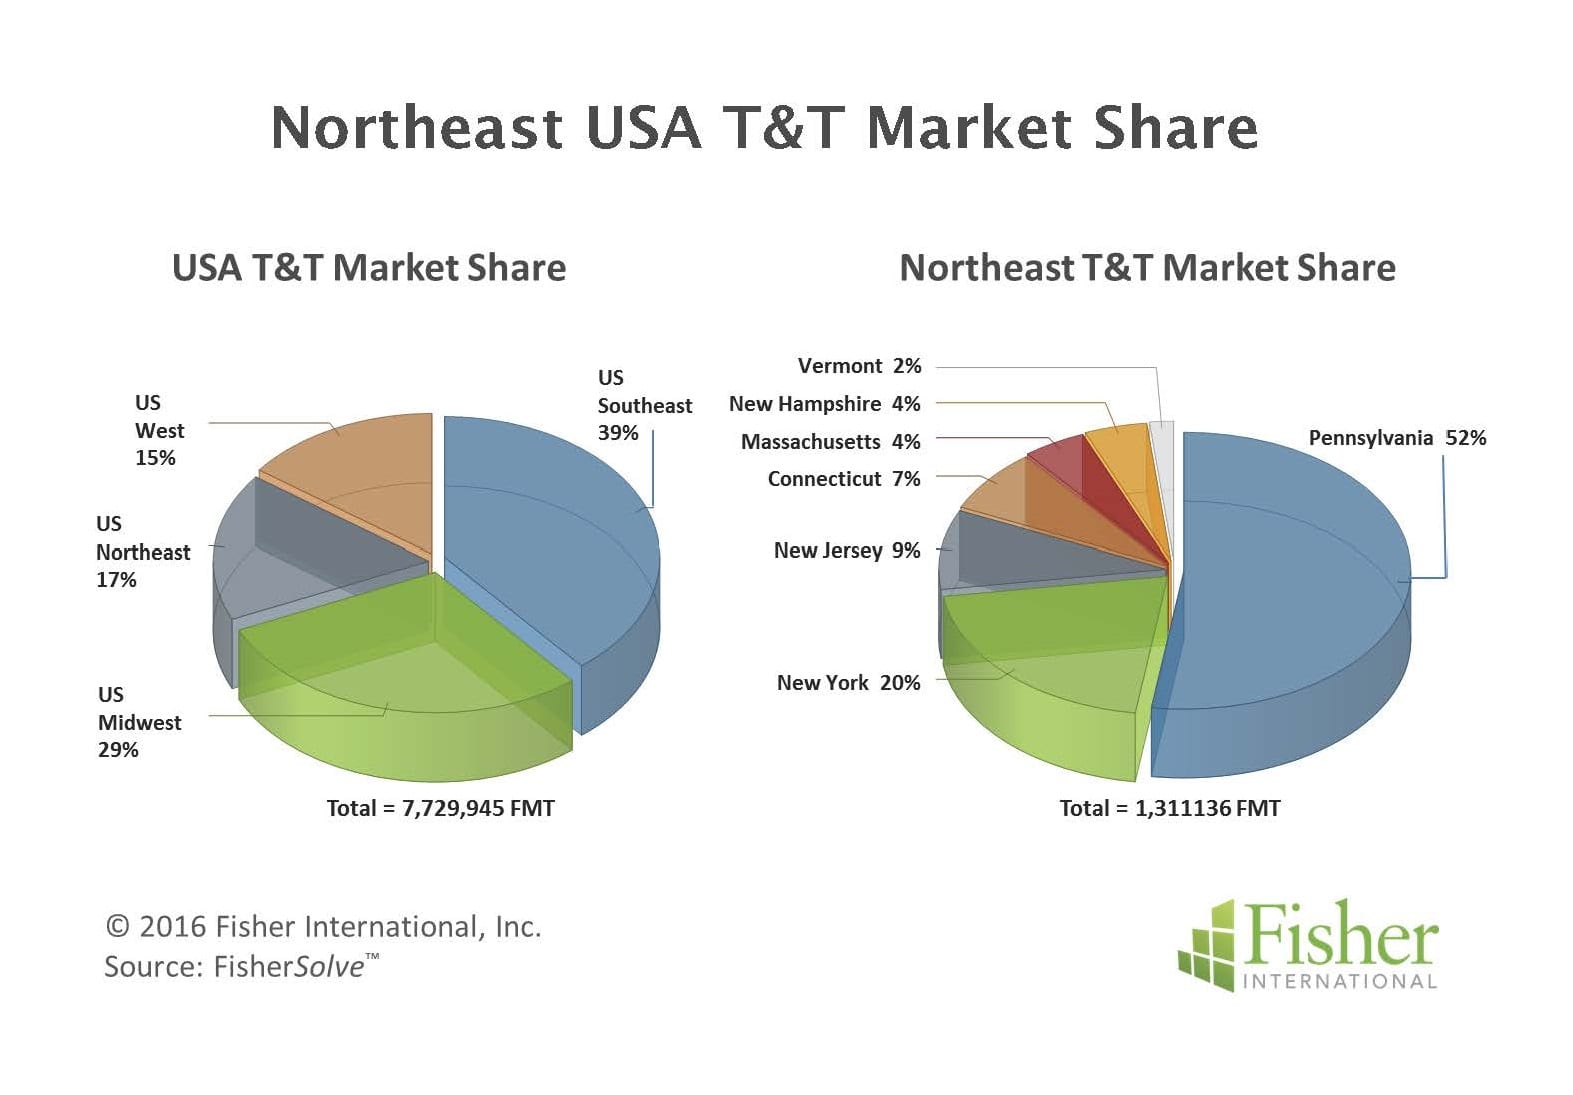
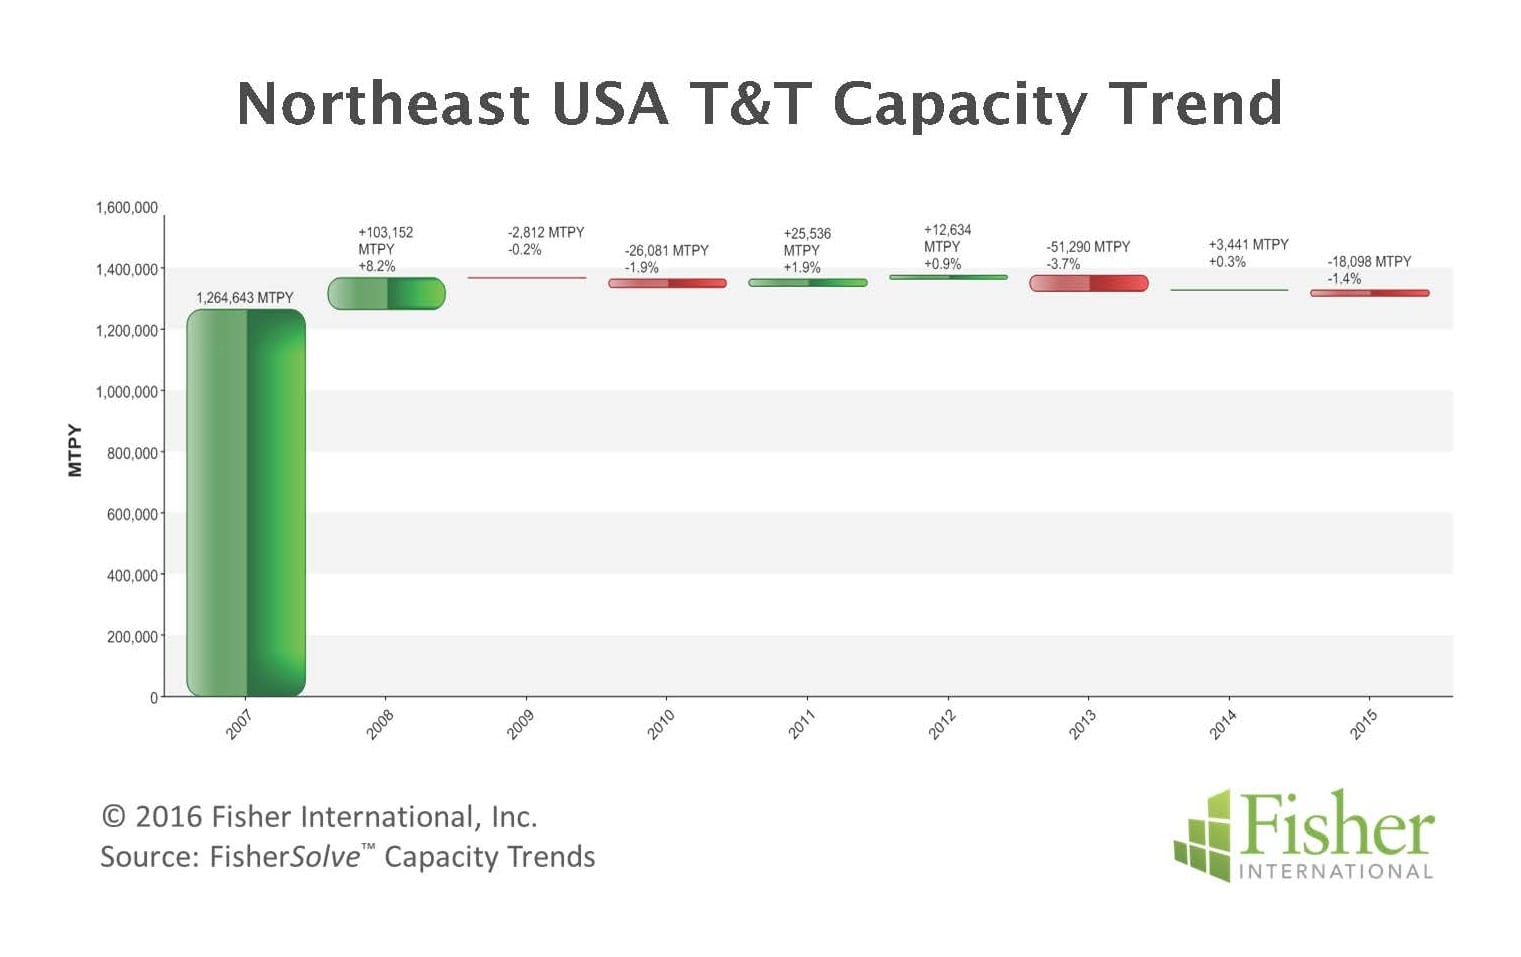
Zooming into the Northeast US region, there are 21 T&T operating mills producing over 1.3 million annual tonnes on 44 tissue machines (Figure 2). Benefitting from its proximity to the rest of the US, the state of Pennsylvania ranks highest within the Northeast, commanding more than 50% of the region’s capacity (Figure 3). New York state ranks second with 20% share and five states share the remaining 30% with less than 10% each. Northeast US capacity growth trend has been flat since 2007 with modest gains offsetting losses over the period (Figure 4). Geographically the Northeastern mills are widely dispersed across seven of the nine states that comprise the region. Only Maine (historically a T&T state) and Rhode Island have no operating T&T mills at this time (Map).
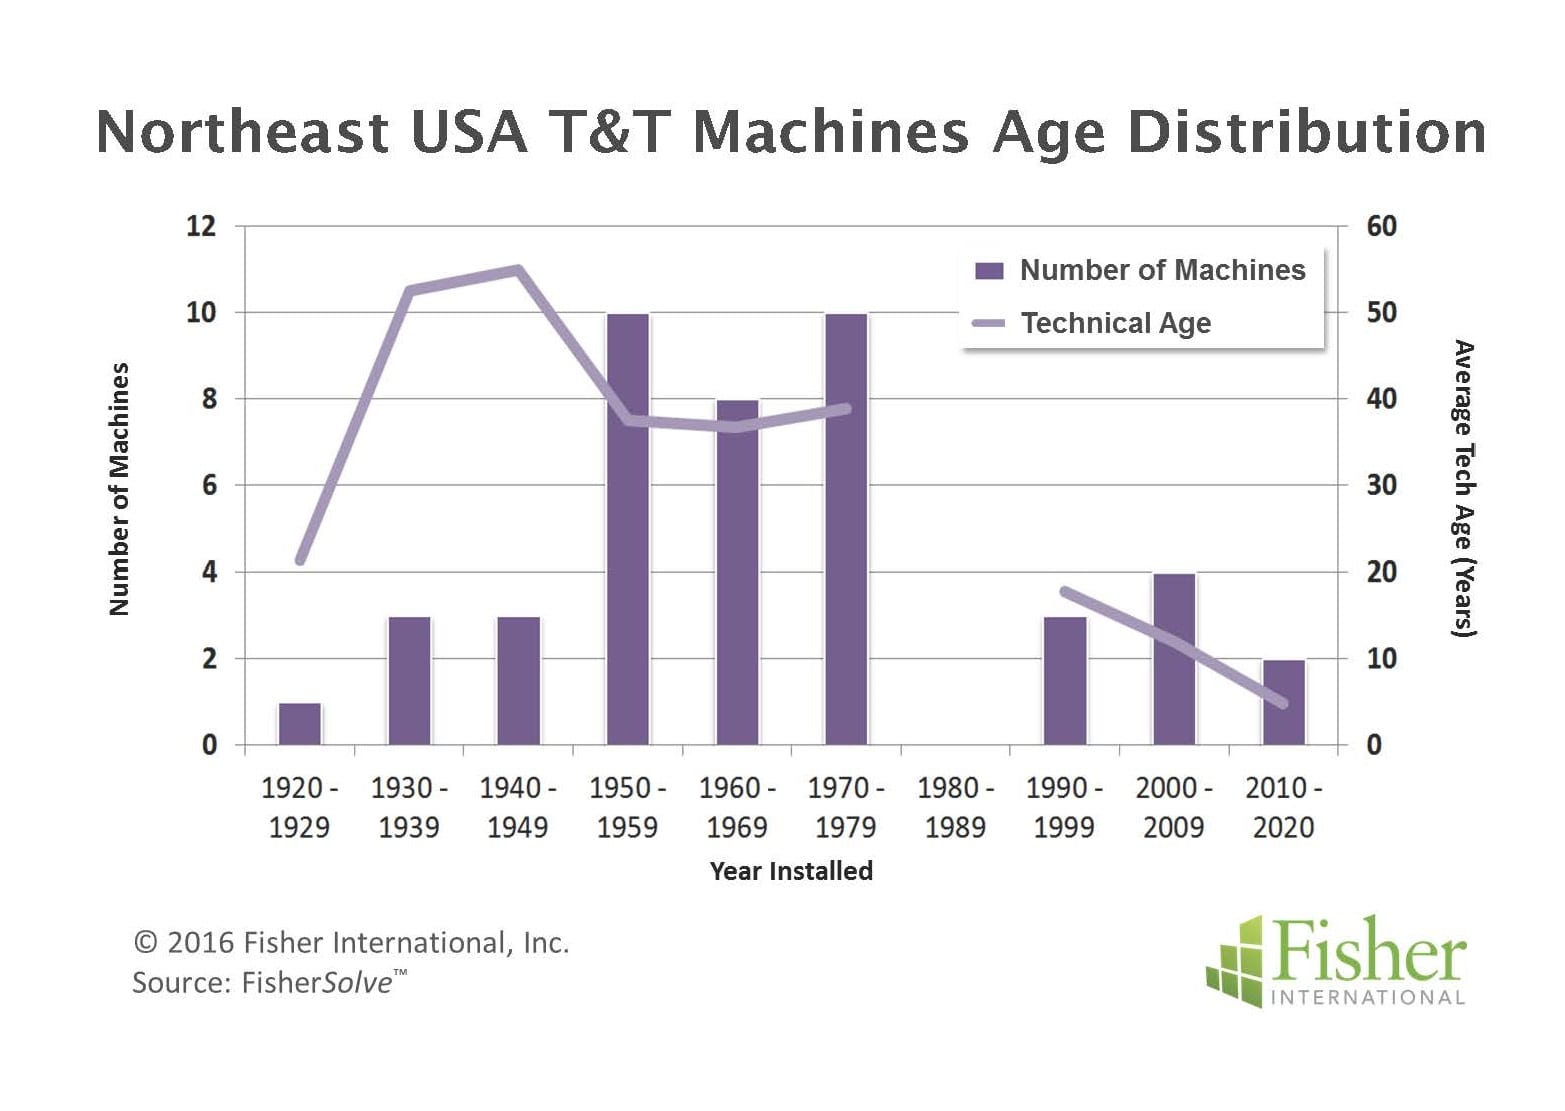
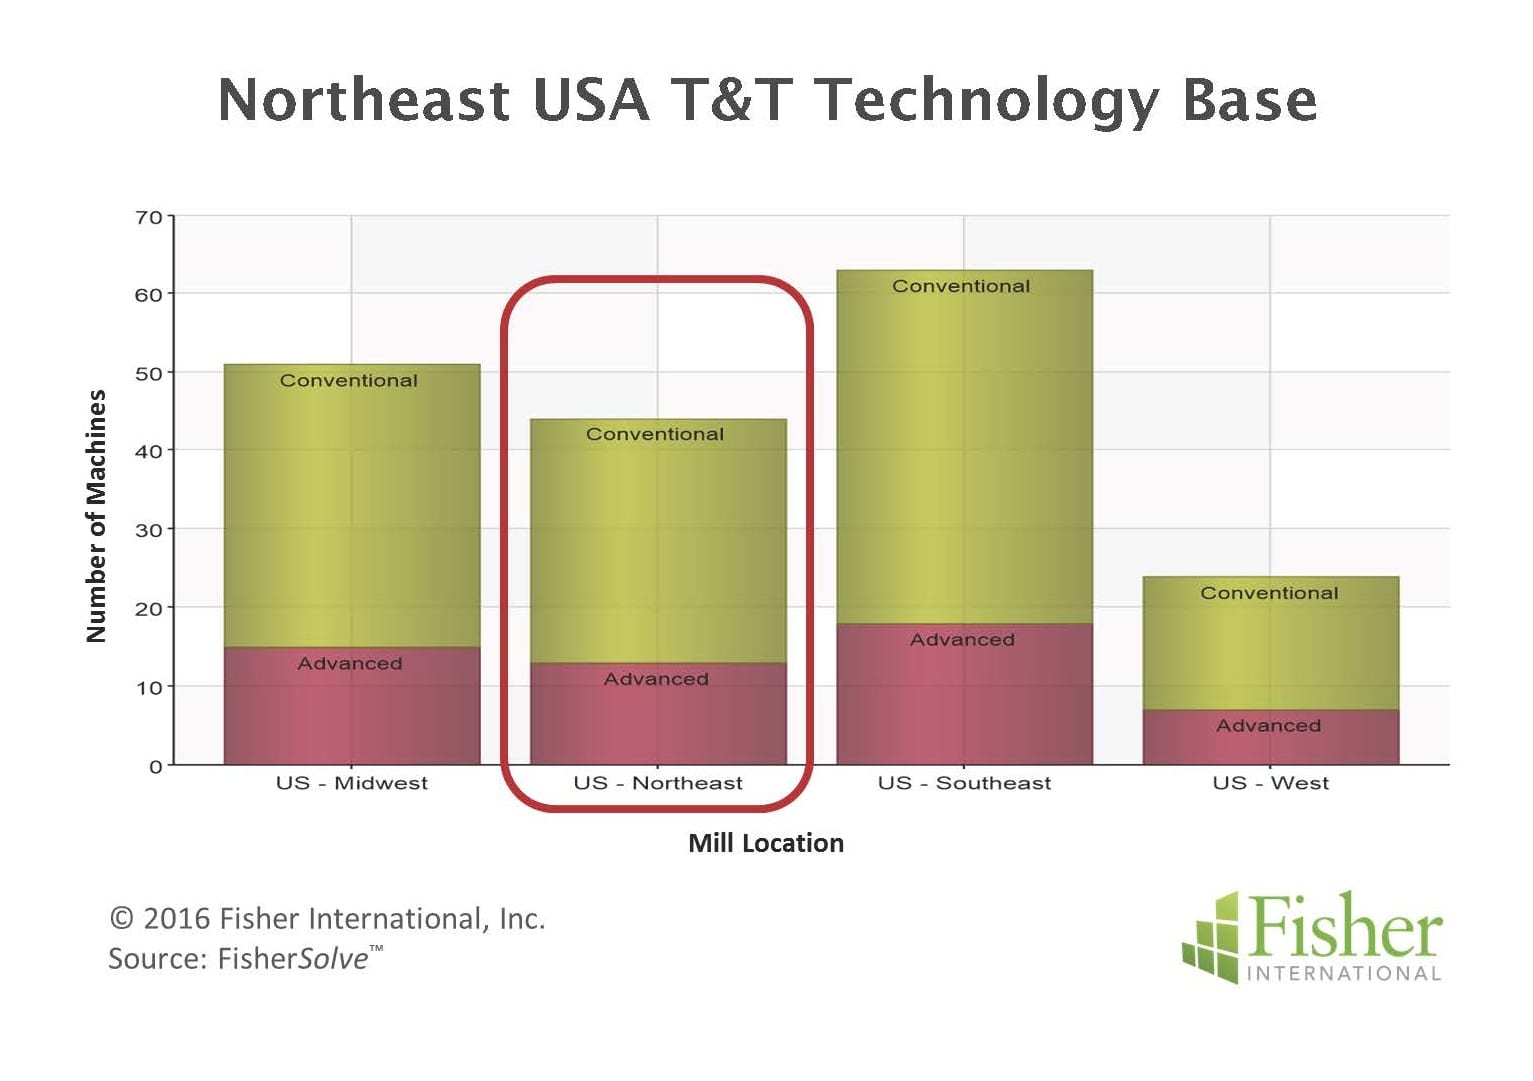
The asset base in the Northeast can be considered dated with a high concentration of machines having been installed in the 1950 to 1980 time frame. What’s more, there are almost as many machines operating with pre-1950 installation dates as there are with post 2000 dates. The technical ages (a calculated age based on upgrade timing and extent) suggest there has been only modest interest in modernising the machine base (Figure 5). Technology base in the Northeast mirrors the other three US regions with about 30% being “Advanced” versus “Conventional” paper machine configurations. In the case of the Northeast, the Advanced Technology deployed is all Through Air Drying (TAD) (Figure 6).
There are 13 TAD machines operating in the Northeast. Of these, eight are very early vintage installed on machines dating back to the 50’s, 60’s and 70’s. The five newer TAD machines all date 2001 or newer.
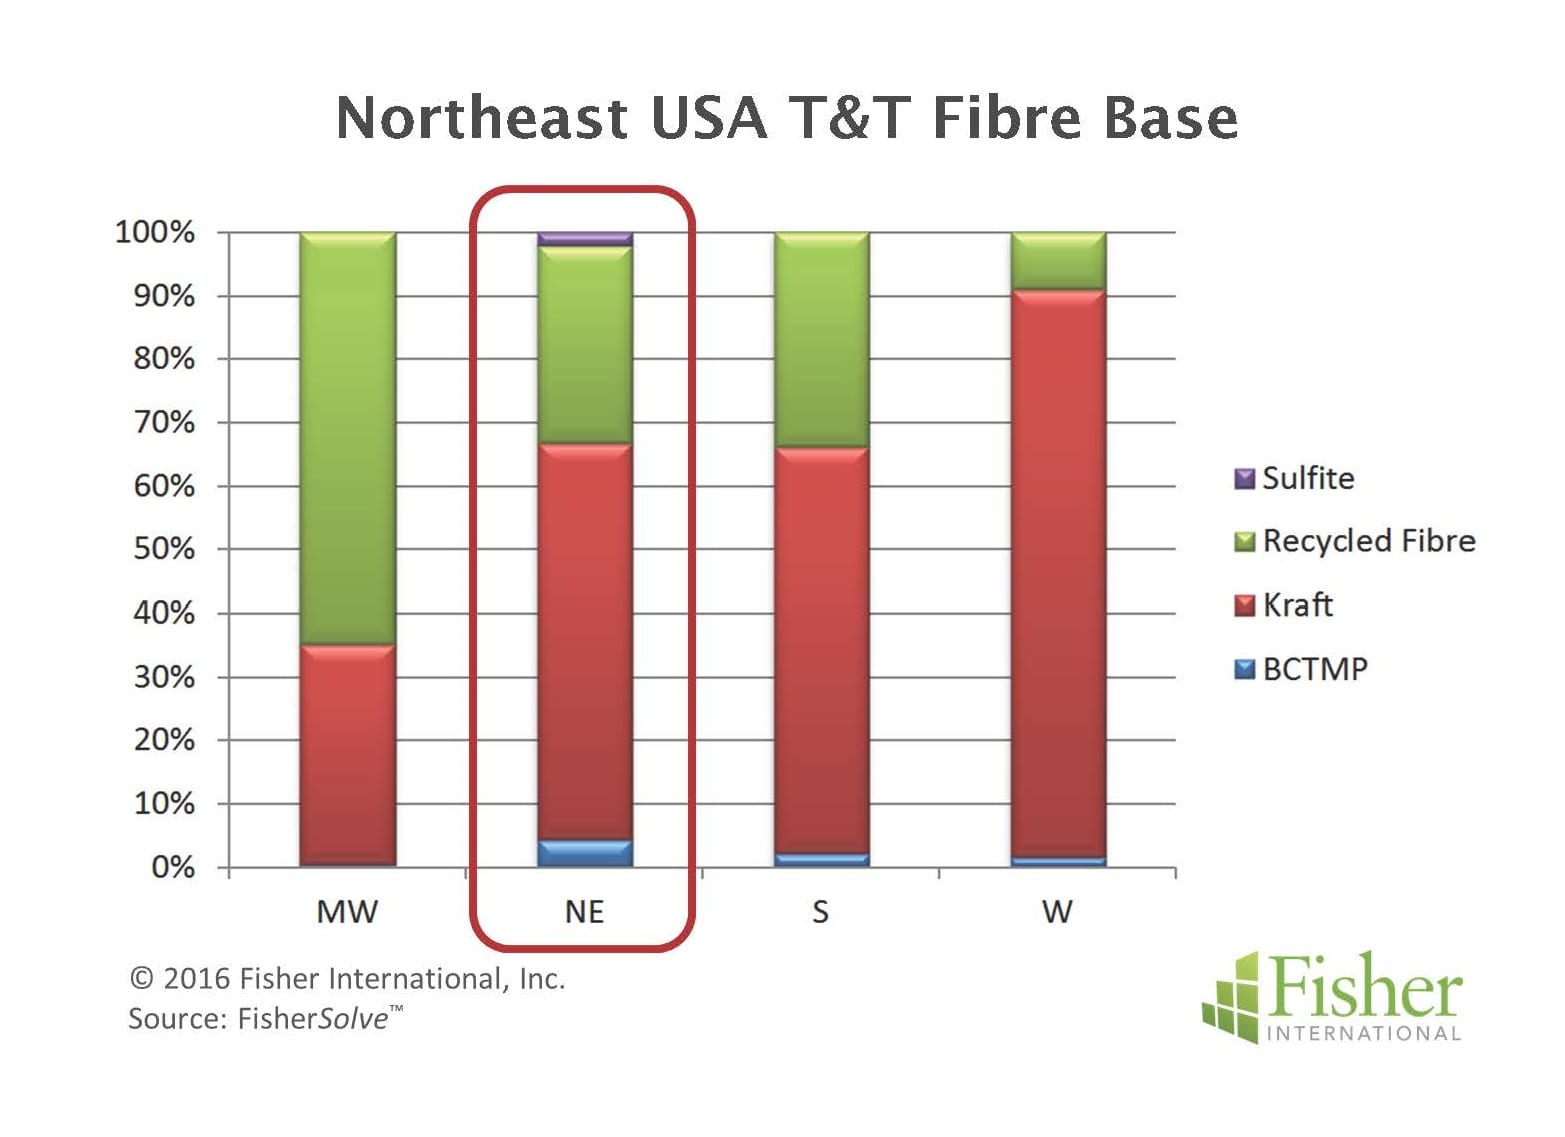
Fibre mix across the four US regions is interesting. The Northeast and South are biased to Kraft pulp but still have considerable recycled fibre in use (Figure 7). Unlike the South and Northeast, the West is very heavy Kraft while the Midwest is heavy recycled fibre.
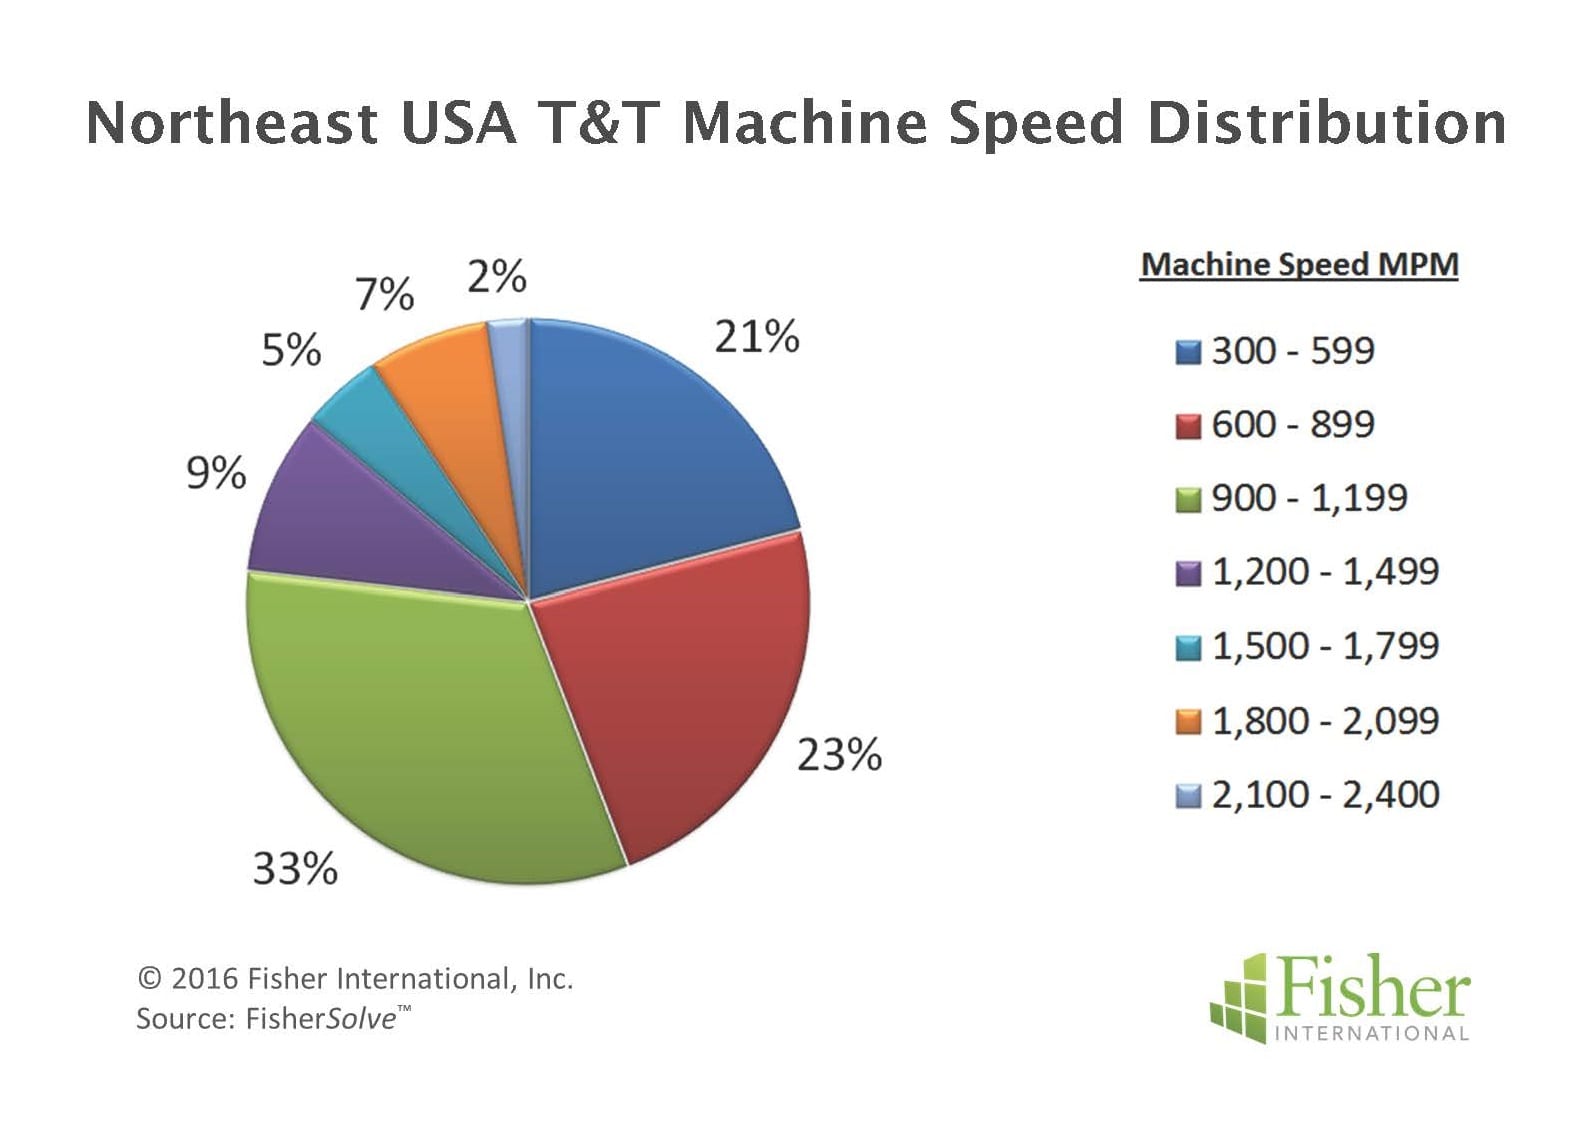
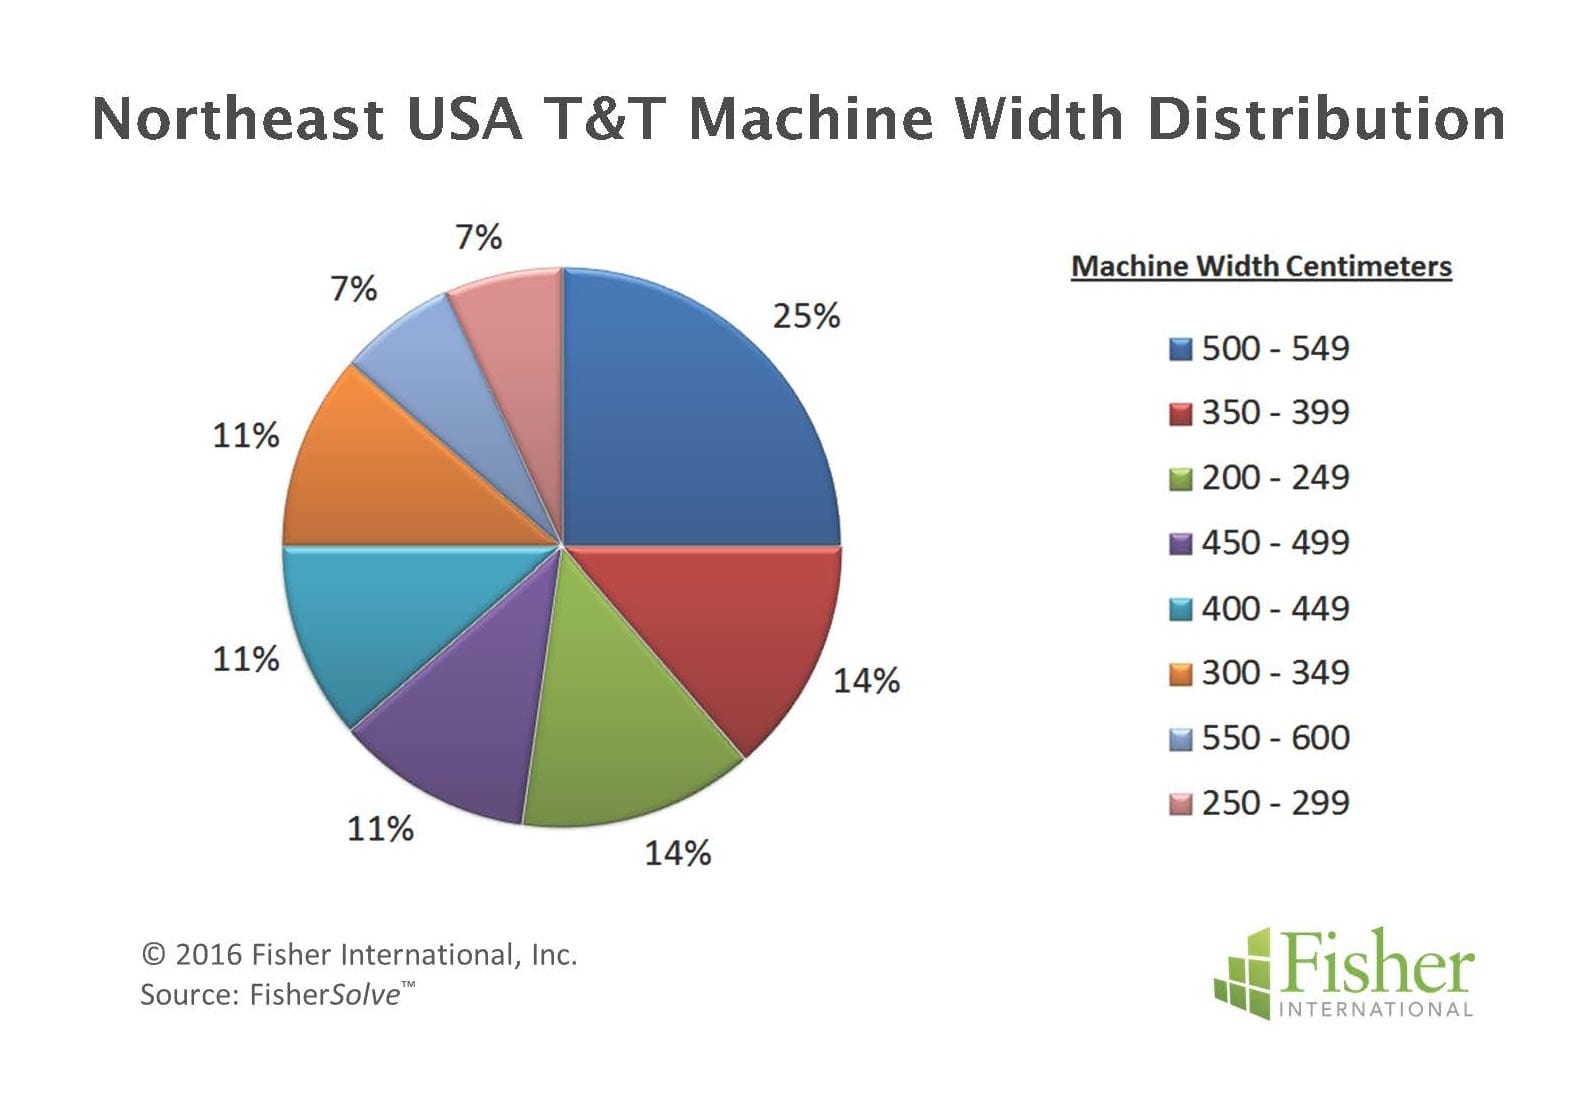
Machine profiles indicate relatively narrow widths and modest- to slow operating speeds. Speed ranges are commensurate with the age distribution. Lines range in the less than 600- to above 2100 MPM. About 60% of the lines fall below 1200 MPM which correlates directly with the age distribution (Figure 8). Widths follow a similar pattern with 25% of the lines in the 5-metre range and the remainder all less than 4 metres (Figure 9).
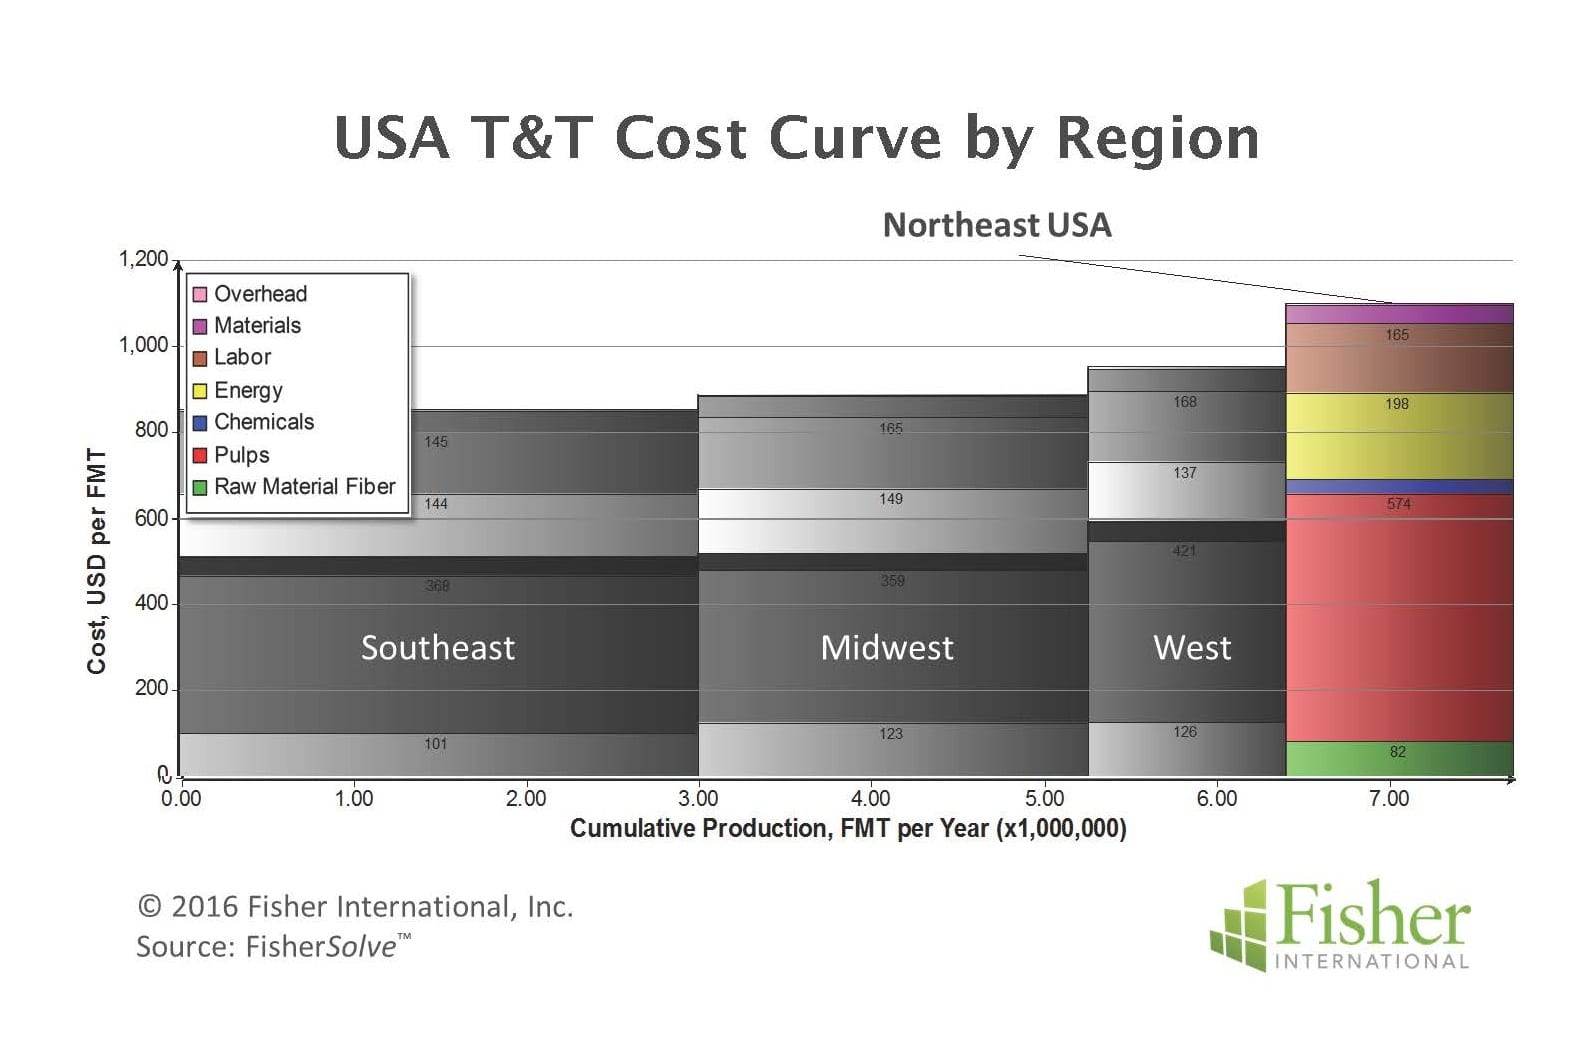
A cost competitiveness assessment of US T&T mills indicates the Northeast has significantly higher cost than the other areas (Figure 10). Interestingly, the high-cost position is not driven by scale or age inefficiencies of lines so much as commodity cost, particularly energy and pulp.
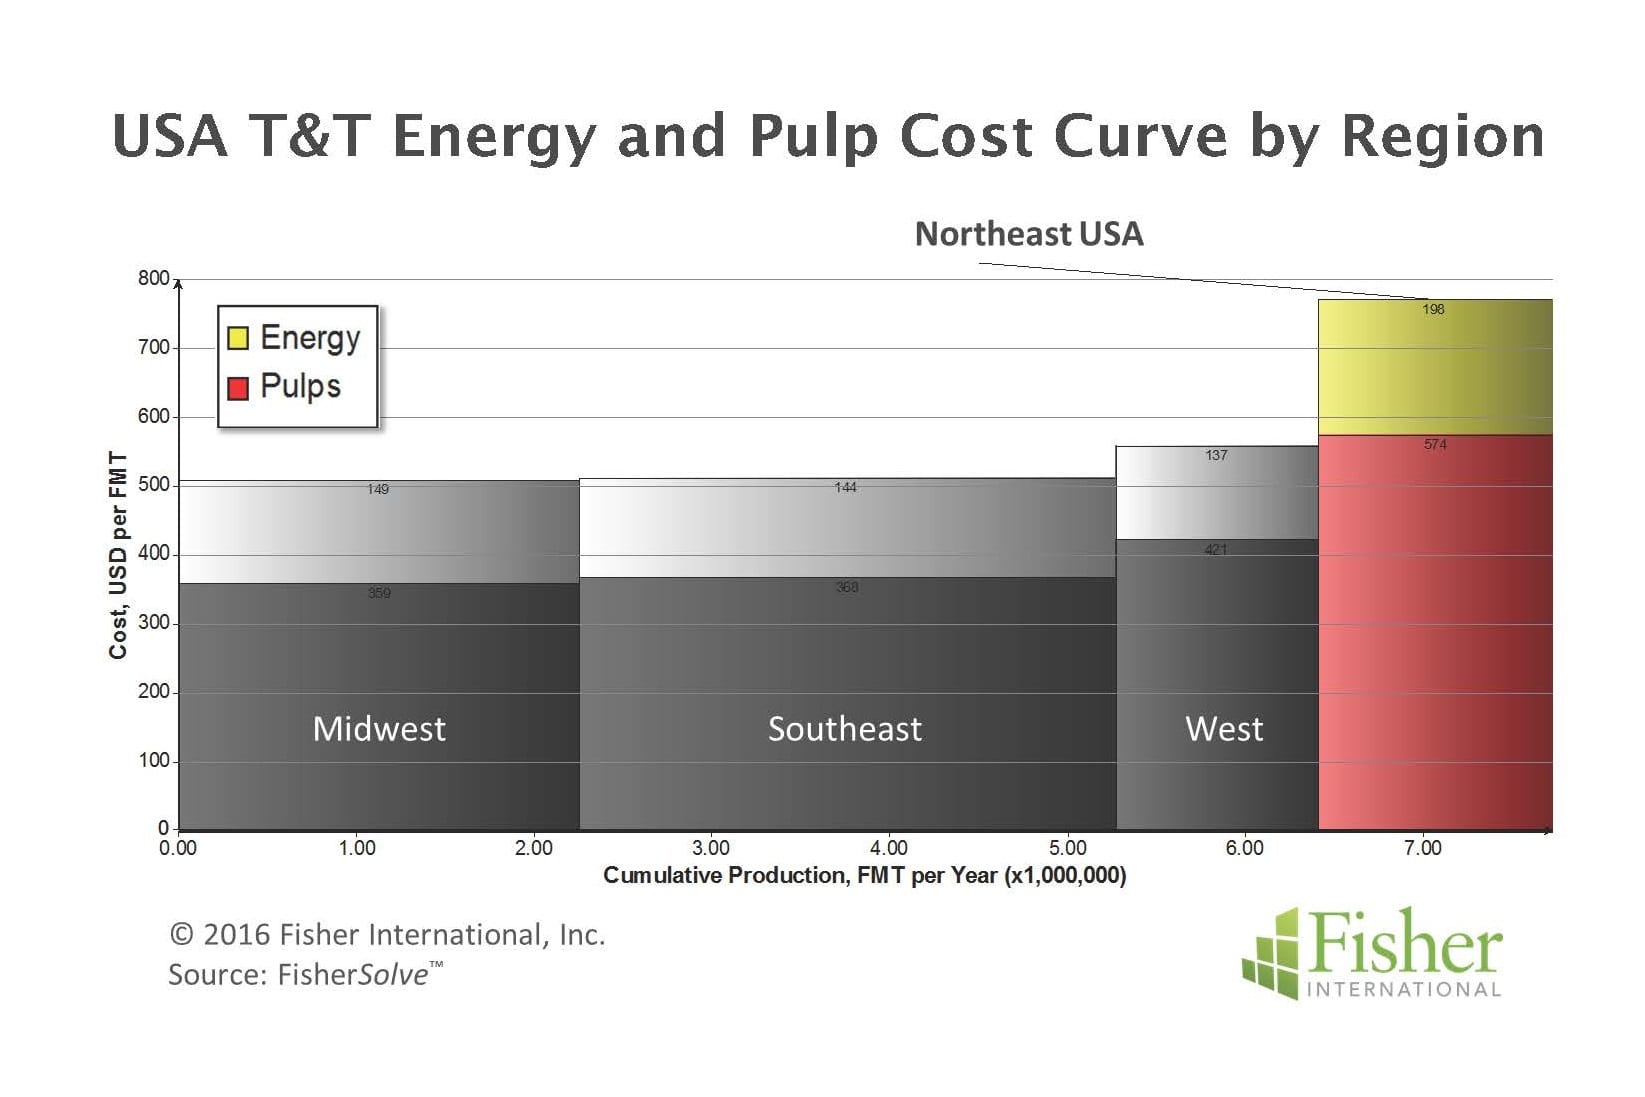
Energy disadvantages are influenced in part by higher gas and electrical pricing. On the other hand, pulp pricing tends to be more uniform across geographic regions. The disadvantage in this cost segment for the Northeast appears to be driven by mix rather than pricing (Figure 11) with heavy reliance on northern pulps.
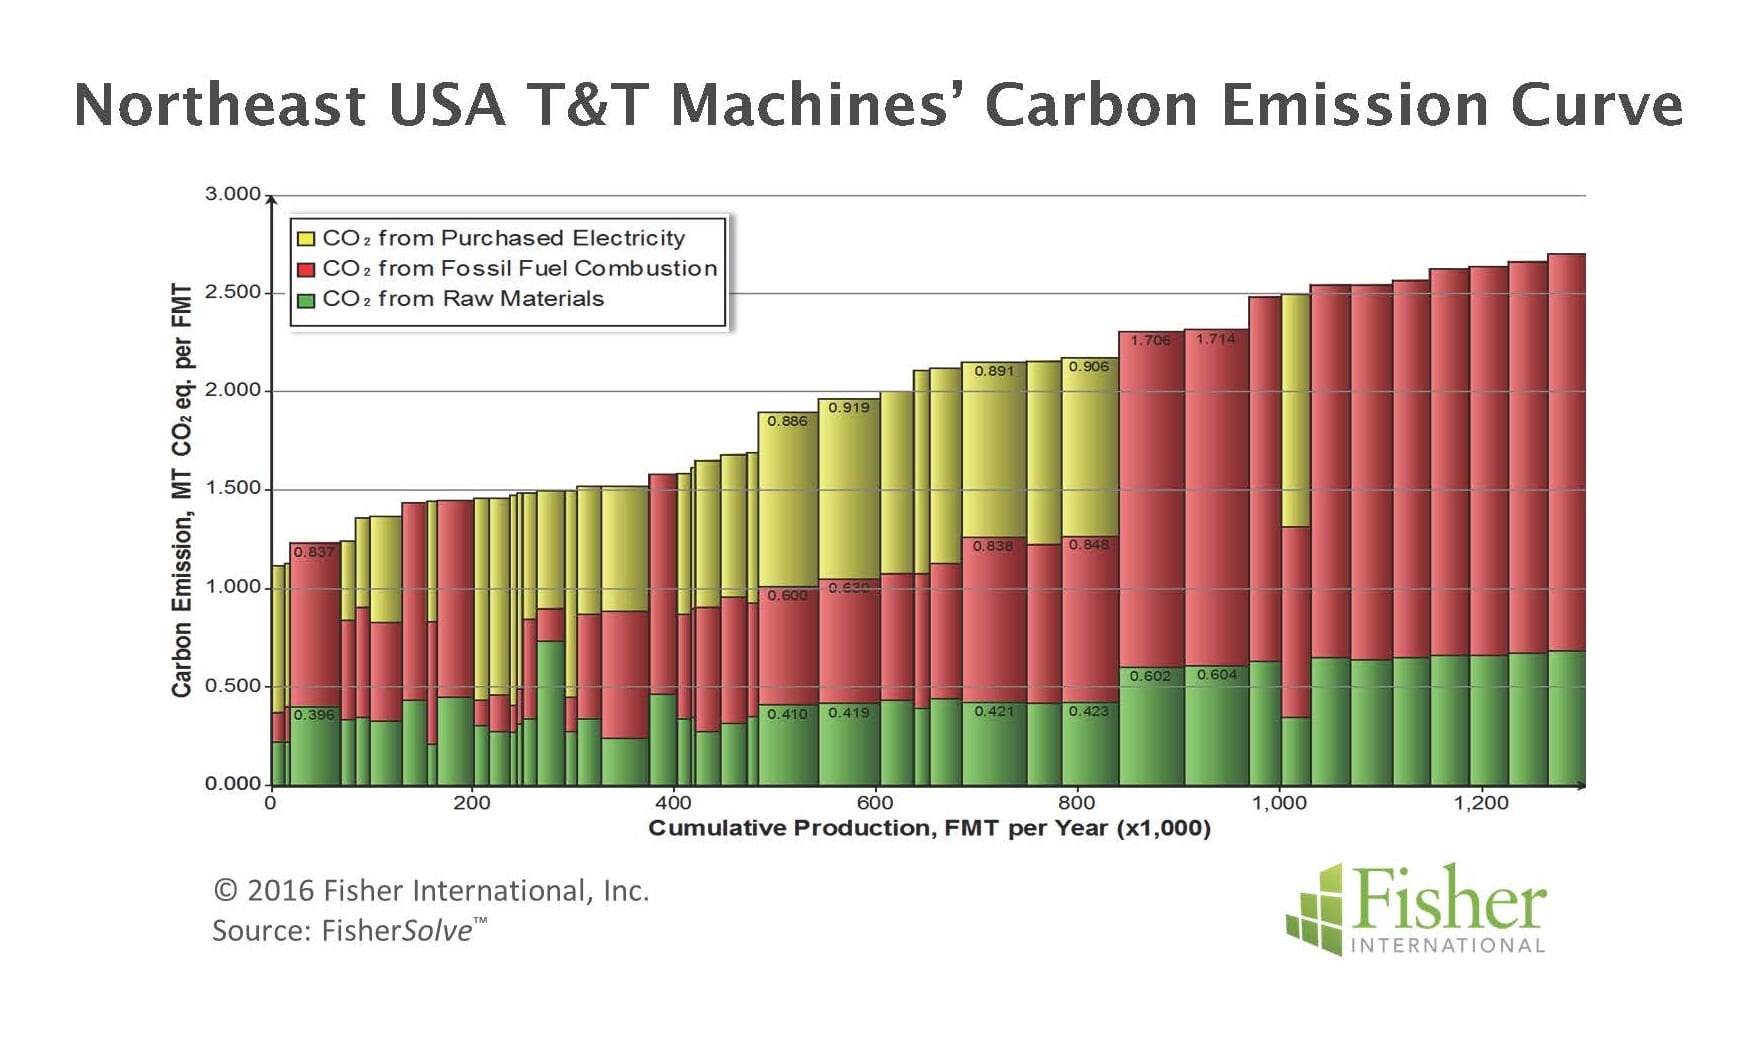
Greenhouse gas emissions and the associated regulatory activity are likely to be a future cost consideration in the US as well as worldwide. Average United States emissions per tonne of T&T (MT CO2 eq./FMT) is 1.683 CO2 eq. The US Northeast averages 1.999 CO2 eq., slightly higher than the worldwide average but lower than all but the West within the US (Figure 12). At a machine level there are very dramatic differences. The range is from 1.12 on the low end to 2.70 on the high end. Raw materials contribution is fairly consistent across machines. Purchased electricity and, more importantly, fossil fuels vary greatly. Some of this variation is fuel differences. More significant however is the influence of TAD and the high gas consumption associated with this process. Presumably, as restrictions tighten, the cost of mitigation could be a significant factor in overall cost competitiveness for some players.
The source for market data and analysis in this article is FisherSolve™. Data tables behind Figures 1 –12 can be obtained from Fisher International. E-mail requests to [email protected].


