


The Kingdom of Thailand has the second largest economy in Southeast Asia after Indonesia. The World Bank classifies Thailand as an upper-middle-income economy. The CIA World Factbook ranked Thailand’s economic GDP as 21st in purchasing power parity with exports accounting for about two-thirds of this value. Their economy grew at an estimated rate of 3-3.7% from 2015 to 2017, and Thailand’s population is ranked as 20th in a world with over 68 million people, growing at 0.3%.
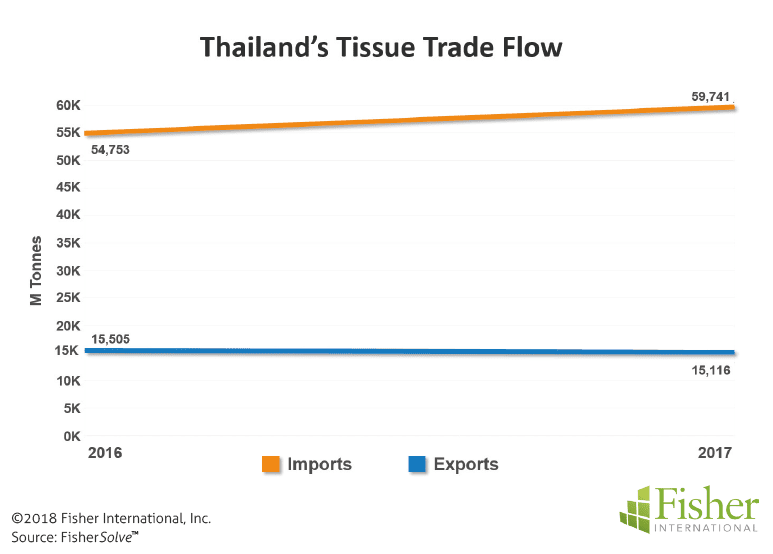
Figure 1, derived from FAO data, shows Thailand’s overall tissue exports have been flat in the last three years, while imports represent greater volume and growth. Figure 2 shows the three-year average exports are well dispersed, with Australia the largest customer. Import activity in Figure 3 is focused on Indonesia providing most of the off- shore production.
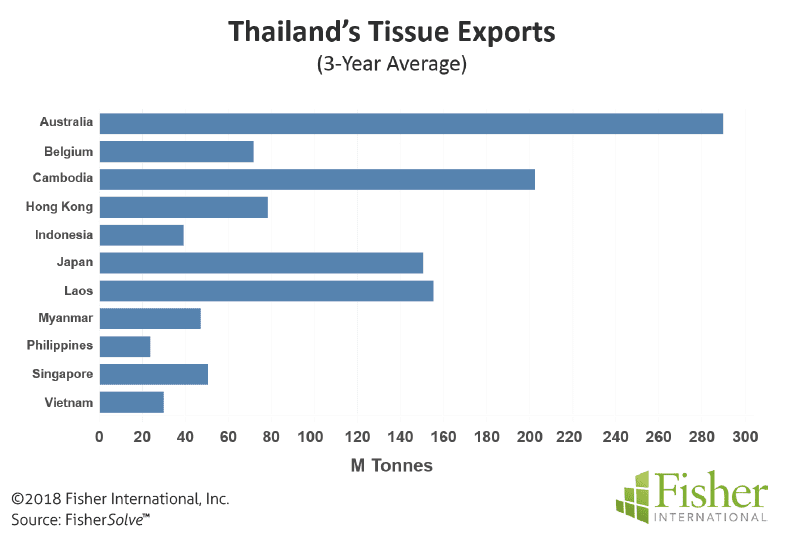
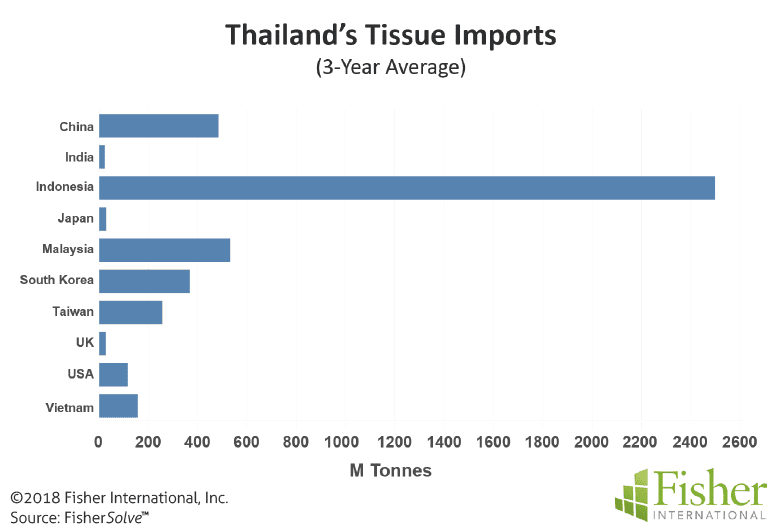
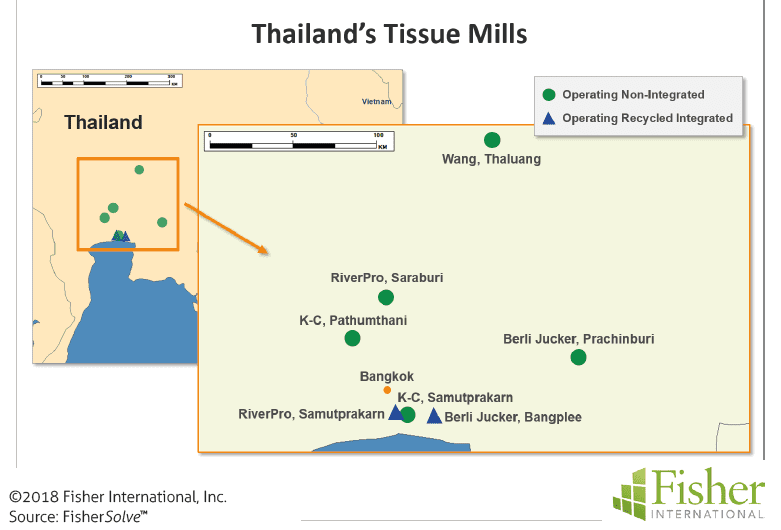
The scale in Figure 3 is 9X the scale in Figure 2. This large import focus will be relevant in examining the evolution of Thailand’s domestic capacity. Most of Thailand’s tissue exports are finished products while over half of imports are jumbo rolls for converting.Figure 4 shows the location of Thailand’s seven tissue mills clustered near the Gulf of Thailand and the capital Bangkok. Owners of these mills are Berli Jucker Group; Kimberly-Clark Corp.; RiverPro Pulp & Paper Co.; and Wang N.T. Paper Co. The integrated recycled fibre sites are green circles and the non- integrated sites are blue triangles.
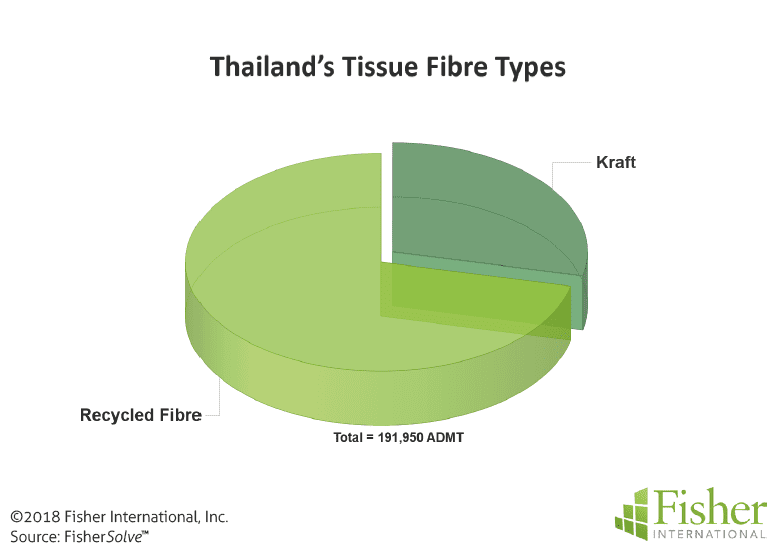
Consumer product grades are the focus of Thailand’s tissue business. Most of his production is based on recycled fibre as shown in Figure 5. Several of the sites are integrated with recycled pulp production. Figure 6 provides a more detailed look at Thailand’s tissue furnish by product type. Consumer bath tissue is the largest product format and deinked fibre is the most common furnish with some kraft pulp. Consumer facial is the next largest product, and kraft pulp is the most common furnish type using mostly hardwood.
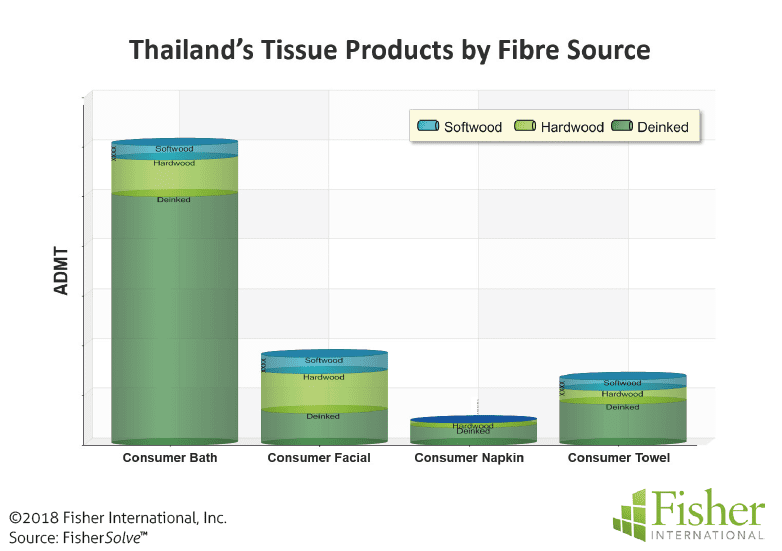
Consumer towel products use both deinked and virgin fibre. The virgin kraft furnish is about half softwood in contrast to the other grades where hardwood predominates. Consumer napkin is the smallest product category. The primary furnish for napkins is deinked fibre as in bath tissue.
Thailand’s tissue capacity has grown at annual rate of 3.28% in the last 12 years through new mills and tissue machines. Figure 7 shows three new mills or sites added between 2013 and 2014. Wang N.T. Paper Co., entered production with their Lopburi Mill, and RiverPro Pulp & Paper Co. added the Nong Khaei and Taeparak Mills in 2014.
These mill additions brought the total number of tissue machines up to 15 in 2016 before the shutdown of the tissue machine #1 at Kimberly-Clark’s Samutprakarn Mill in 2017. Figure 8 shows the net change resulted in a total of 14 operating machines in 2018.
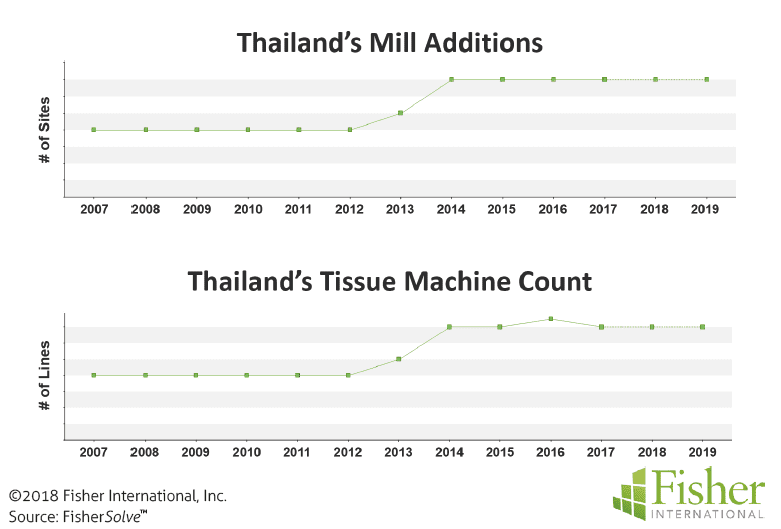
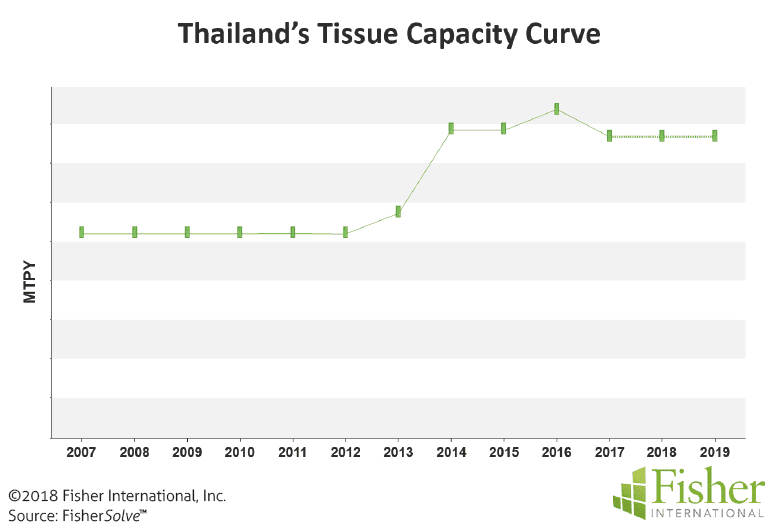
Figure 9 shows the tissue capacity curve effects as larger machines came on-line replacing a smaller line. This represents a 3.28% CAGR (Cumulative Annual Growth Rate) over the period shown for 191,949m tonnes per year in 2018.
Figure 10 provides an average manufacturing cash cost and cumulative production ranking by country in the Asia Pacific Region. Looking at Thailand’s tissue industry relative to the rest of the region, Thailand tissue mills represent a relatively small portion of the overall production in a region where China produces the largest amount. However, Thailand’s average cash cost position looks good, positioned just after the larger Indonesian capacity costs.
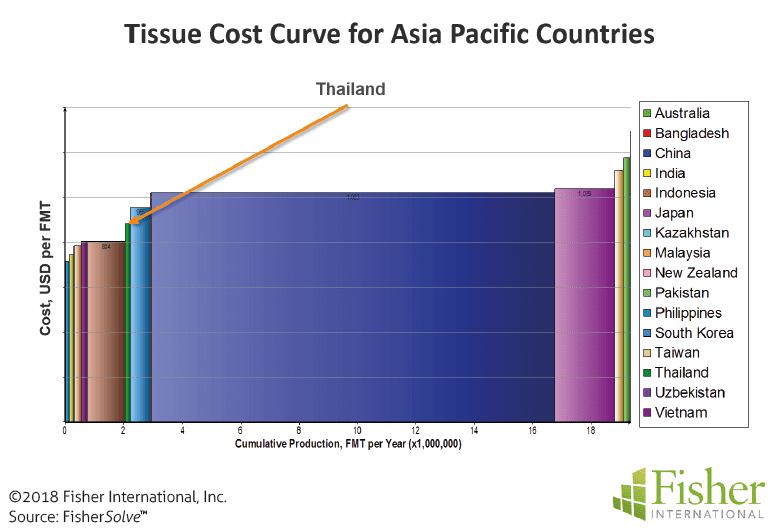
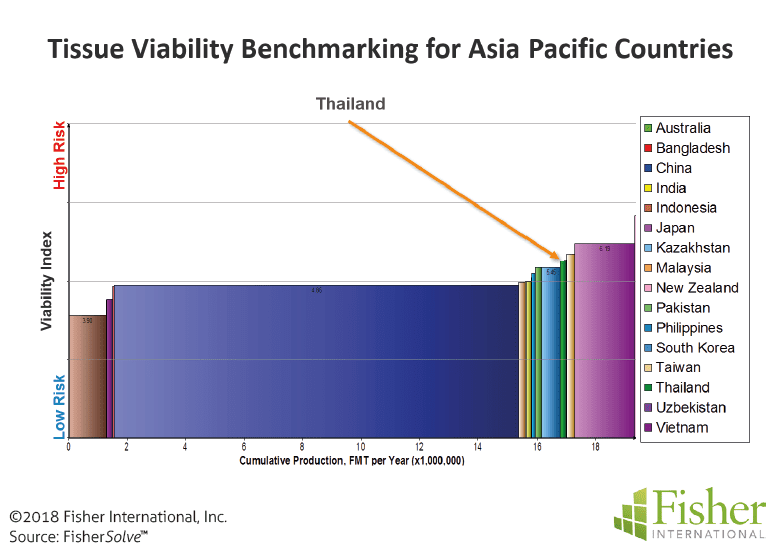
Figure 11 shows another way of rating production capability between countries in the region. The cash costs of Figure 10 are replaced by the Fisher International Viability Index that takes into account not only the cash costs but the capital required, size, technical age, and productivity of the mills and machines relative to the region. Here we see that Thailand is falling behind as other countries in the region are expanding their tissue capacity faster with newer and more productive equipment.
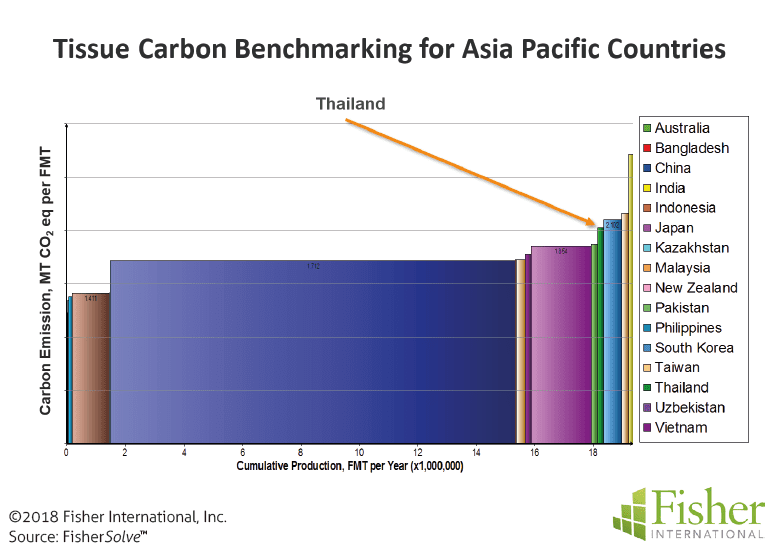
Figure 12 shows another method of evaluating Thailand’s tissue business relative to the overall Asia Pacific Region. This chart uses the same format as the Figure 10 (Costs) and Figure 11 (Viability) but now examines the Asian Pacific Tissue industry by country regarding Total Carbon Emissions. Carbon emissions are expressed as MT CO2 eq per tonne of tissue production. Total emissions include raw materials, fossil fuel consumption, and purchased electricity. Carbon emissions are becoming a viability factor in some regions. This chart looks similar to Figure 11 indicating that some of the components of carbon emissions are related to technical age and productivity factors.
Conclusions
Thailand’s tissue industry is based mostly on recycled fibre and focused on the consumer product grades. Tissue exports are small but imports, primarily parent rolls, exceed 30% of the domestic production. Current manufacturing cash costs are lower than average in the Asia Pacific Region, but viability and carbon emission curves suggest that domestic production can expect more pressure from parent roll imports. Indonesia would likely continue to be a major source of parent rolls and possible converted products.
About Fisher International, Inc.
Fisher International supports the pulp and paper industry with business intelligence and strategy consulting. Fisher International’s rich databases, powerful analytics, and expert consultants are indispensable resources to the industry’s producers, suppliers, investors, and buyers worldwide. FisherSolve™ is the pulp and paper industry’s premier business intelligence resource. Complete and accurate, FisherSolve is unique in describing the assets and operations of every mill in the world (making 50 TPD or more), modeling the mass-energy balance of each, analysing their production costs, predicting their economic viability, and providing a wealth of information necessary for strategic planning and implementation. FisherSolve is a product of Fisher International, Inc. For more information visit: www.fisheri.com or email info@fisheri.com USA: +1-203-854-5390


