


By Bill Burns, Senior Consultant, Fisher International
Brazil’s economy was in a strong growth cycle when the global financial crisis of 2008 hit, when its GDP growth rate plummeted from 4+% down to zero. However, recovery from the crisis was swift and strong with GDP bouncing back 7.5% in 2010. Since then, the economy has been contracting year to year dropping by as much as -3.8% in 2015 (Figure 1 insert). Forecasts suggest yet another period of recovery for 2016 and beyond. With Brazil’s economy struggling, one would expect some difficulty for the pulp and paper industry growth as well. Not so in Brazil. Pulp and paper businesses have been on a sharp positive trend line throughout the period leading into and beyond the global financial crisis. Most remarkable is the growth of Market Pulp capacity in Brazil (Figure 1).
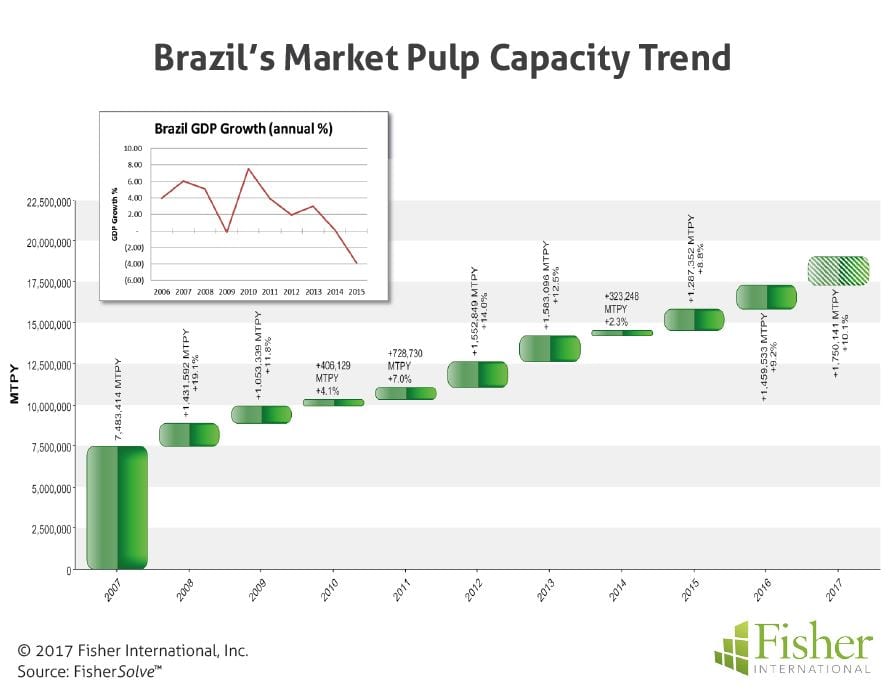
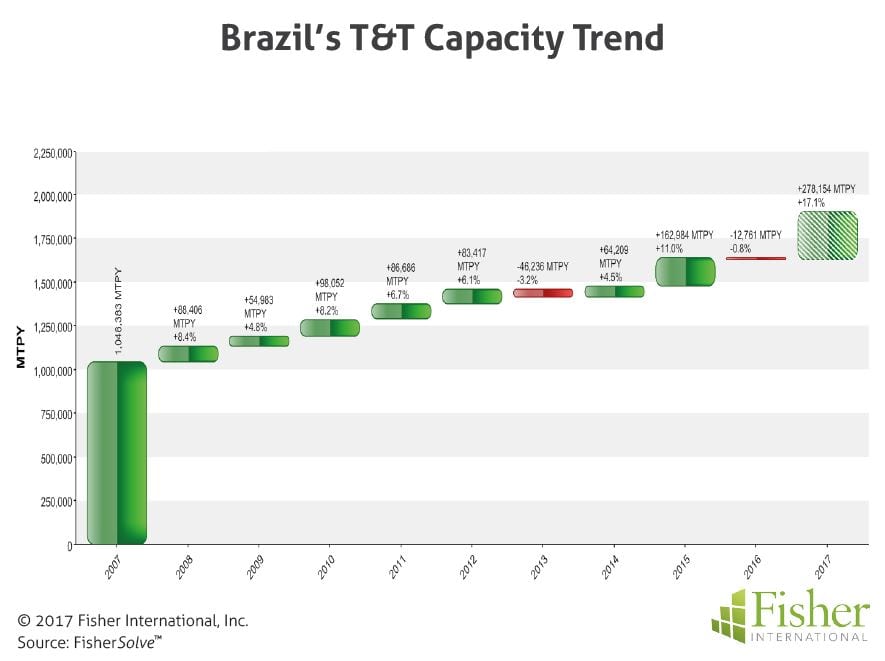
Advantaged by a climate that allows accelerated forest growth rates, engineered tree plantations and strong global demand for fibre, Brazil has become the world’s largest supplier of Market Pulp. For the period between 2007 and 2015 Brazilian Market Pulp capacity experienced a cumulative annual growth rate (CAGR) of 9.8%, more than doubling capacity over the period (Figure 1). Towel and Tissue (T&T) growth was also on an accelerated growth trajectory over the same period. Being comprised of relatively low density products (compared to Market Pulp), T&T products are not normally exported great distances like pulp or more dense paper products. But despite exportability disadvantage, T&T grew at a CAGR of 5% over the same period (Figure 2). In 2016, Brazil was the 5th largest producer of T&T worldwide moving up from 6th in the past 10 years. The fluctuating economic fortunes of Brazil seems to suggest that once GDP growth brings with it increased T&T demand, the habits that consumers form are not rescinded during an economic downturn.
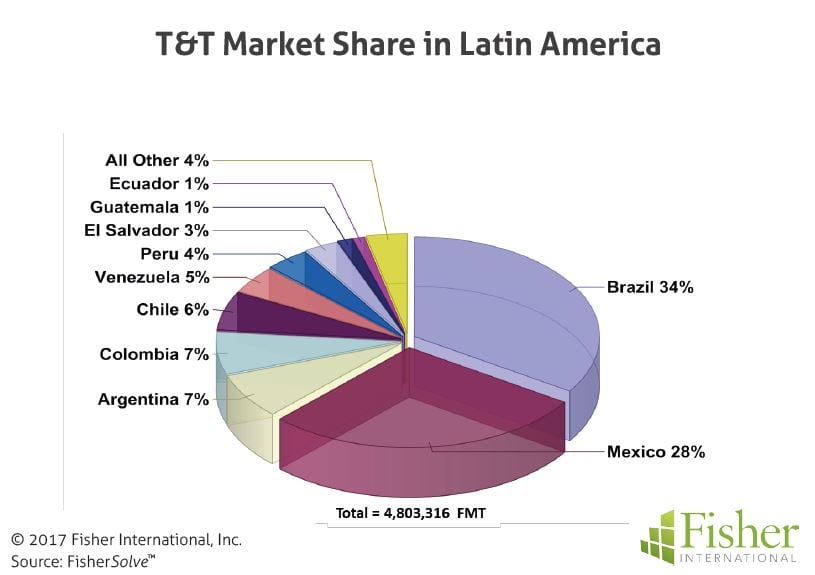
Brazil’s natural market is primarily local with export opportunities and competitive threats from surrounding Latin American countries. Within Latin America, Brazil holds a 34% share of the T&T market – a 6% share lead over Mexico, the next largest producing country. Geographically and in terms of distribution cost, Brazil is at an advantage vis-a-vis much of the Latin American market. Brazil’s capacity position within the South American continent is commanding, out producing the closest competitive countries by a factor of nearly 5 to 1 (Figure 3). Given its proximity to excellent and abundant fibre and distribution geography, Brazil, the most populous country in Latin America, is poised to be a market leader for some time to come.
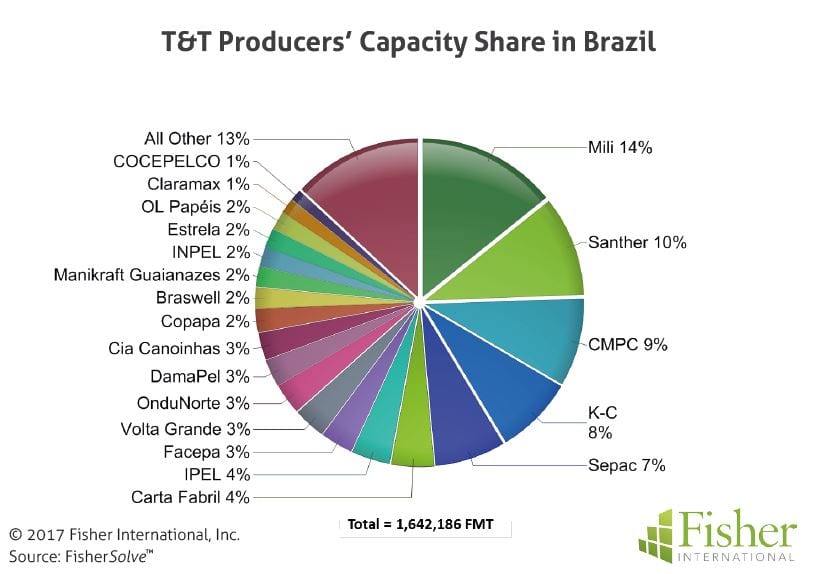
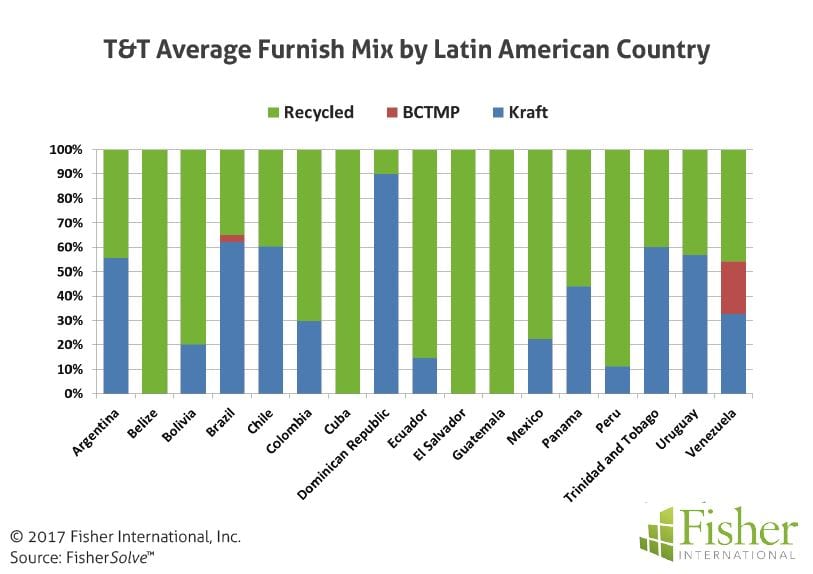
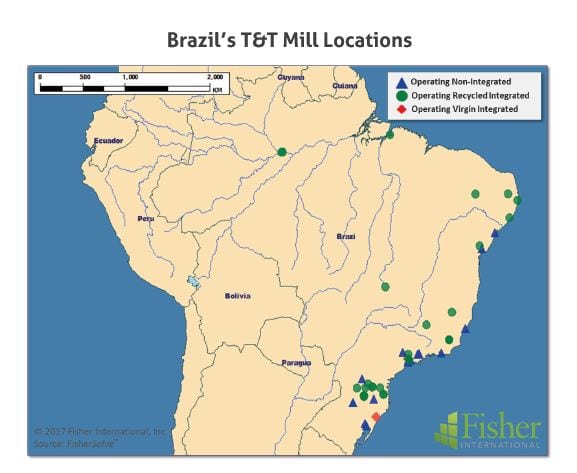
Focusing now on the companies, mills and machines that make up the T&T industry in Brazil, and the competitive environment in Latin America, it is obvious from the start that the industry is not very consolidated. There are forty producer companies, the largest of which represents a modest 14% share of total capacity (Figure 4). Thirty five of the producers hold less than 5% share of capacity. Interestingly, the individual mills are heavily dependent on integrated recycled or purchased virgin pulp. Only two mills are virgin integrated and only one of those is fully integrated (See Map). It is curious that more of the pulp mills are not at least partially integrated through paper. Comparatively, Brazil is slightly higher in the use of virgin pulps than the other countries with the Dominican Republic being the exception (Figure 5).
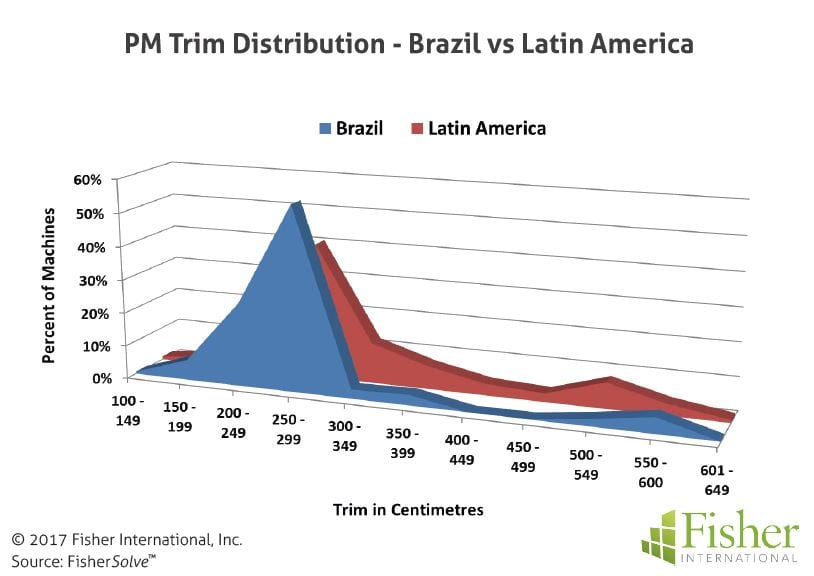
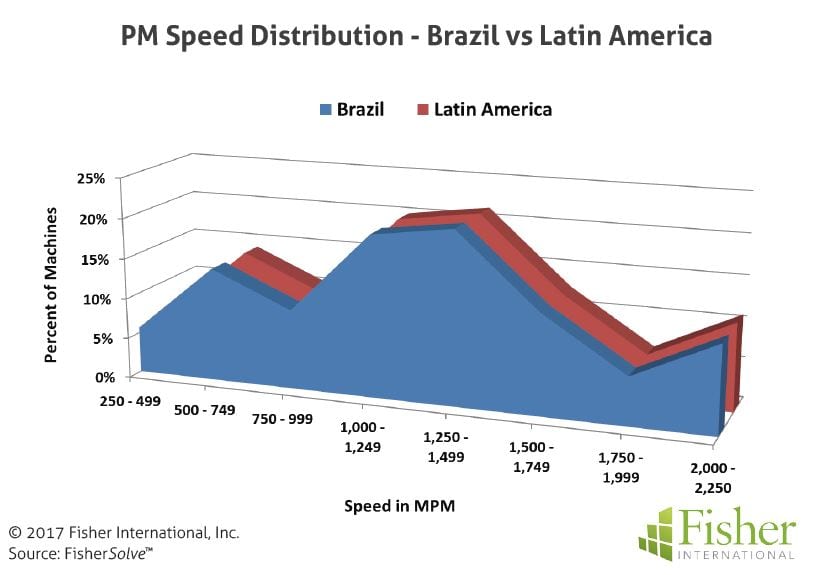
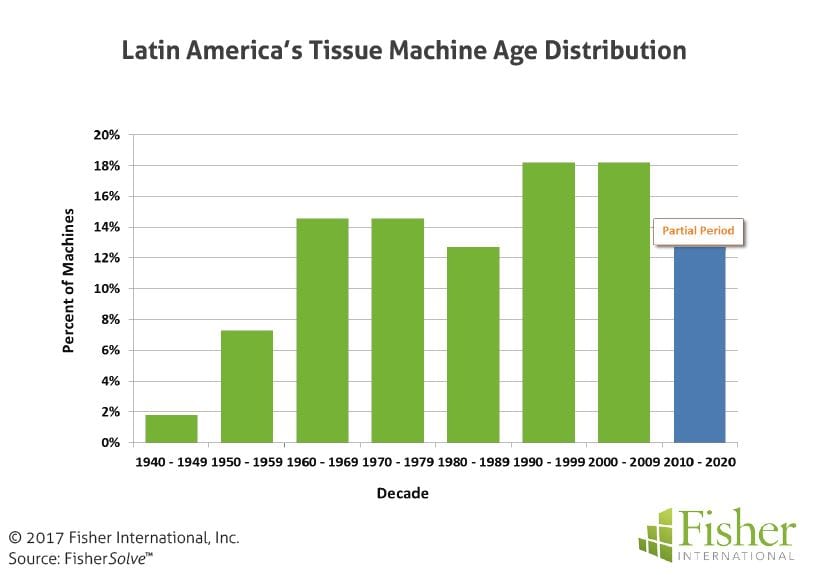
Paper machines in Brazilian and non-Brazilian mills are predominately narrow with 80% being in the two- to three-metre trim range (Figure 6) and of modest speeds with 70% being less than 1,500mpm (Figure 7). About 1/3 of the Latin American machines were installed after the year 2000 which is not surprising given the growth discussed earlier. Another 1/3 were installed between 1980 and 2000, leaving only 1/3 that could be characterised as aging machines (Figure 8). All but one of the Brazilian machines are conventional tissue paper machines. The exception is one “Advanced Technology” machine, which is a designation given to machine processes making structured non-compacted webs (TAD, UCTAD and ATMOS for example). In Brazil’s case the Advanced Technology machine is a Thru Air Drying (TAD).
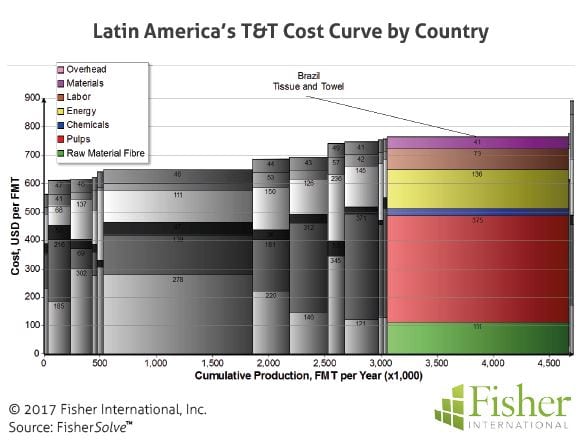
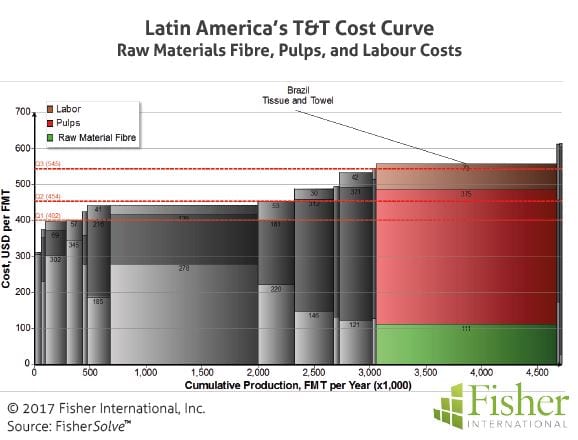
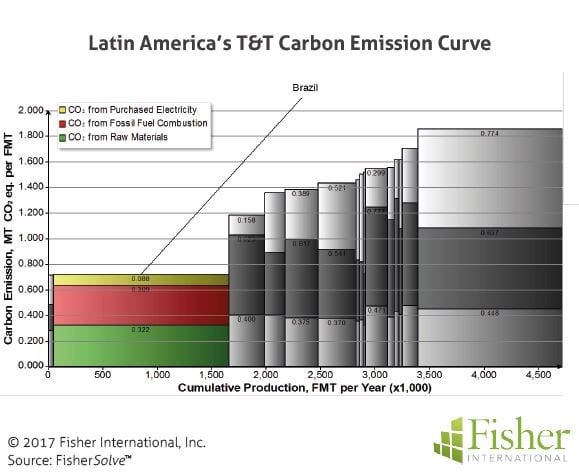
Brazil’s cost position in high among the Latin American countries. More than half of the capacity in Latin America is lower cash cost than Brazil (Figure 9). The high cost position is primarily driven by fibre (combination of raw materials and pulp) and labour. On a quartile basis, Brazil is 4th quartile for these three cost components (Figure 10). Carbon emission penalties and capital mitigation costs are potentially significant factors in the future. In this area, Brazil is in a much better position than the other Latin American countries. Brazil’s estimated emission levels are 1st quartile for the region (Figure 11) and significantly lower than all competing capacity.
In summary, Brazil’s T&T business is enjoying strong growth even with the tough Brazilian economy. Many of the assets are new but small in scale. The T&T market is highly segmented with many small players and lacking a clear market leader. Mills and machines appear to be following a right-size strategy decoupled from pulp production which is good for local markets and product flexibility. It will be interesting to observe this market when the growth rate slows. Will the right-size strategy shift to economy-of-scale with larger machines? Will pulp producers integrate through paper, driving costs down?
Time will tell.
The source for market data and analysis in this article is FisherSolve™.
About Fisher International, Inc.
Fisher International supports the pulp and paper industry with business intelligence and strategy consulting. Fisher International’s rich databases, powerful analytics, and expert consultants are indispensable resources to the industry’s producers, suppliers, investors, and buyers worldwide.
FisherSolve™ is the pulp and paper industry’s premier business intelligence resource. Complete and accurate, FisherSolve is unique in describing the assets and operations of every mill in the world (making 50 TPD or more), modeling the mass-energy balance of each, analysing their production costs, predicting their economic viability, and providing a wealth of information necessary for strategic planning and implementation. FisherSolve is a product of Fisher International, Inc. For more information visit: www.fisheri.com or email [email protected] USA: +1-203-854-5390


