


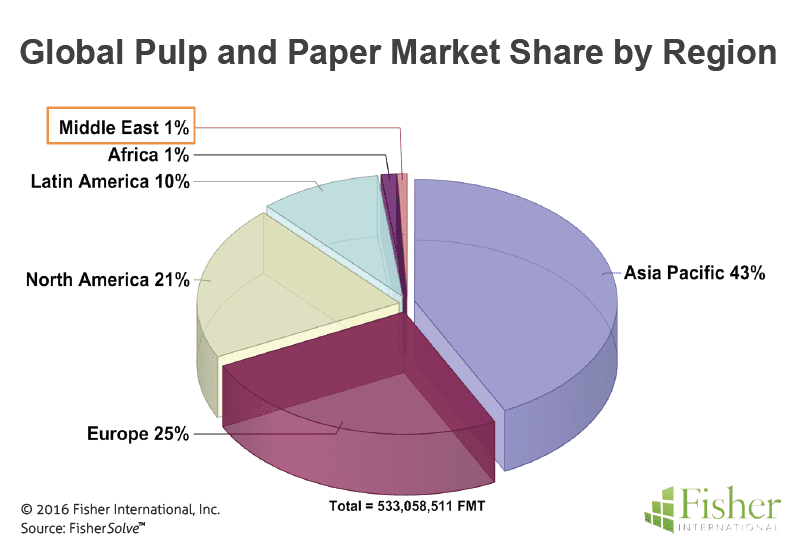
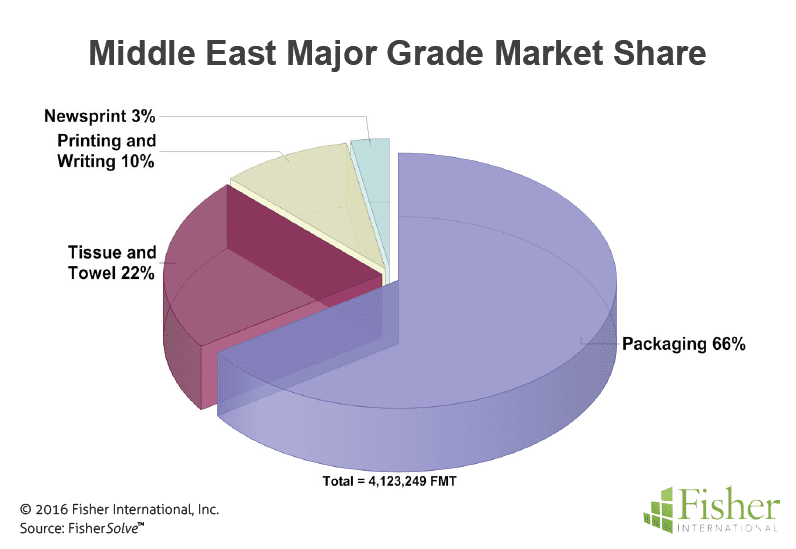
The Middle East region (Egypt and Turkey not included) is a minor contributor to worldwide pulp and paper production. As figure 1 indicates, Asia Pacific is the largest contributor at 43% followed by Europe and North America at 25% and 21% respectively while the Middle East is the smallest contributor by far at 1% of the world’s pulp and paper capacity. The grade breakdown within the Middle East is dominated by packaging production at 66% of the mix followed by towel and tissue (T&T) production representing 22% of the region’s capacity (Figure 2).
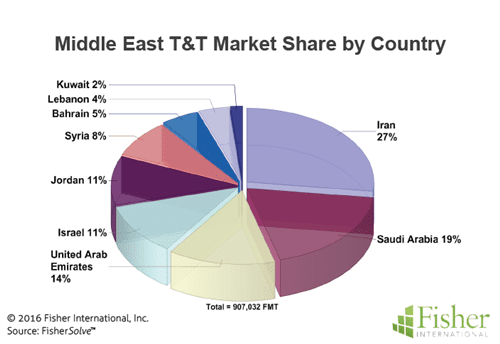
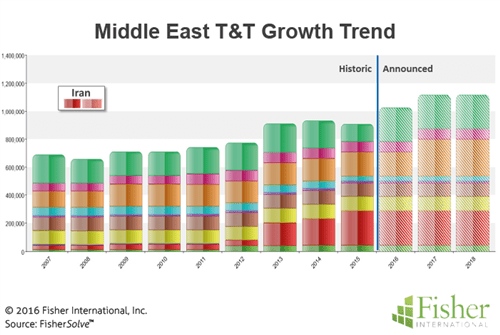
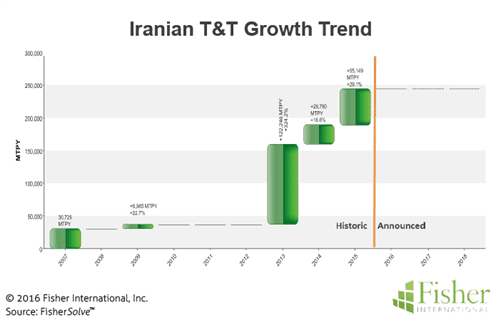
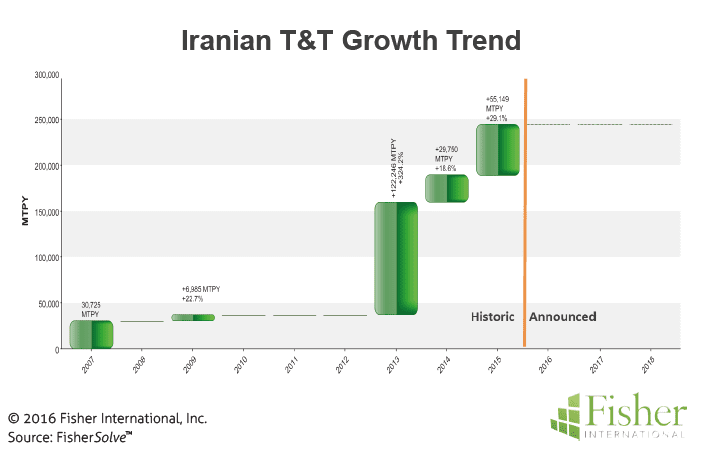
Iran, with a population of about 80 million, ranks first among the Middle East’s T&T producing countries with 27% share of total production (Figure 3). Saudi Arabia, with less than half of Iran’s population is second at 19% followed by the United Arab Emirates with 14% capacity share. Despite crippling UN trade sanctions imposed over the past ten years (with certain sanctions being relaxed following a nuclear accord in January 2016), Iran achieved its leadership position in relatively short order over the past three years with growth that dramatically outpaced other Middle Eastern countries (Figure 4). As the capacity trend analysis in Figure 5 reveals, Iranian T&T capacity experienced a cumulative average growth rate (CAGR) of more than 29% for the period 2007 to 2016 while other countries in the region saw significantly lower growth rates or, in two cases, even negative CAGR.
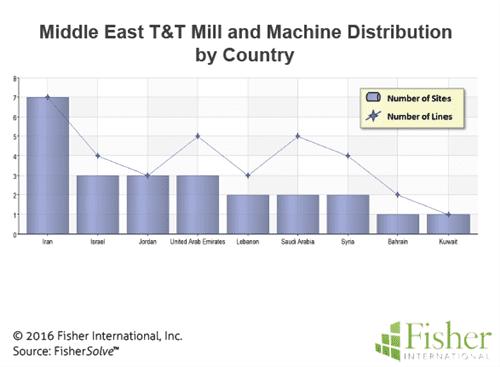
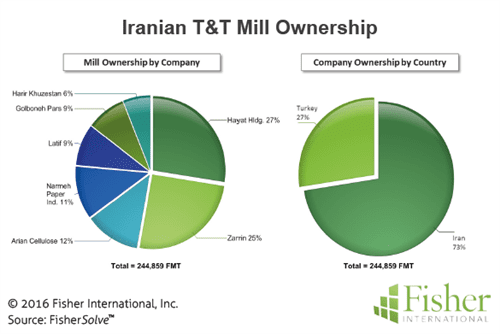
Iran’s seven T&T sites are all single-machine mills each owned by a different company (Figure 6). Six of the seven sites are clustered around the capital city of Tehran and its greater metropolitan population of 16 million. Single-machine mills are not uncommon in the Middle East; those in Jordan and Kuwait are similarly configured (warranted by those countries’ smaller populations and geographic size). Indeed, such sites are suited to areas where the market is predominately local. The proximity of Iranian mills to each other (six of the seven mills are within 100km of each other – see map) is indicative of this pattern. An interesting question for the future is whether growth will continue with new small sites or expansion of existing sites with additional machines.
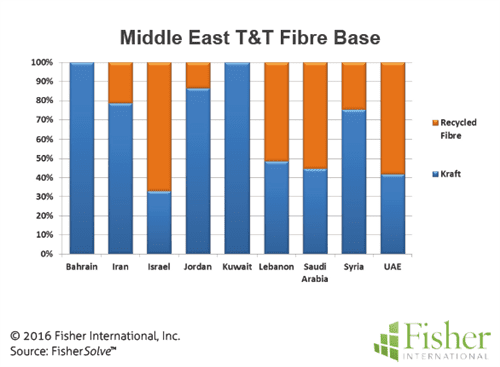
Fibre availability does not appear to be a driving force behind either the size of mill or its location. The fibre base in Iran is primarily purchased kraft pulp with a modest amount of recycled fibre. Relative to other Middle Eastern countries, this fibre mix is common. However, the percent of recycled in the mix is low compared to the other recycled-using mills (Figure 7).

Of the seven separately owned T&T mills in Iran all but one are Iranian; the one exception being Turkish (Figure 9).
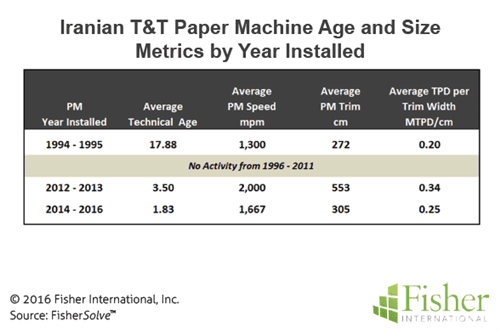
The technical age and actual age of Iran’s T&T machines are essentially the same given that the machines are all mostly new installations. Trims and speeds represent a base of effective machines with competitive speed capabilities and respectable trim for regional markets (Figure 8). Productivity, measured on a metric tonne per day per cm basis, is similar for both old and new narrow machines and slightly higher (at a rate of .34 MTPD/cm) for the wider, faster machines.
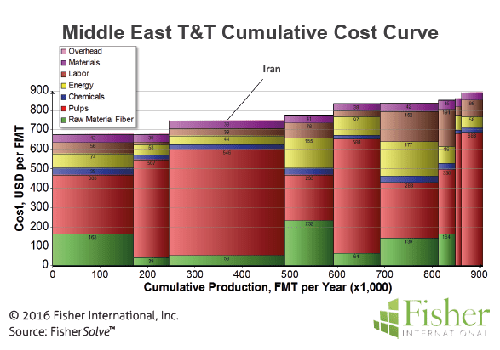
Iranian T&T has a solid competitive cost position within the Middle East being, on average, less than $75 per FMT above the region’s low-cost producer, Saudi Arabia (Figure 10). Fibre strategy and energy are the key differentiating cost drivers in the Middle East. Mills with high use of secondary have a cost advantage over those using high percentages of purchased virgin fibre. Iran’s disadvantage to Saudi Arabia comes, in large part, from its mix of about 80% virgin fibre versus less than 50% in Saudi Arabia. Energy cost varies significantly. Iran has an excellent energy profile compared to other Middle Eastern countries. Iran also has a good labour cost position compared to other countries. With labour costs at $39 per FMT, Iran is competitive with other low-cost countries and significantly lower than the high-cost counties.

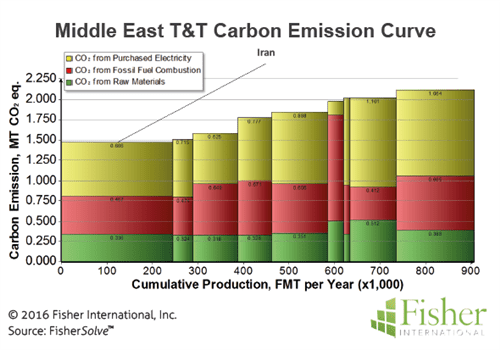
Carbon emission is often considered, along with cost, as an indicator of potential future capital and operating mitigation costs that could impact overall cost position. Iran is the lowest emitter in the Middle East at 1.47 MT CO2 equivalents (Figure 11). Although lowest among its peers in the Middle East, this level is high-second-quartile worldwide and just slightly off the worldwide average of 1.57 MT CO2 equivalents. Purchased electricity accounts for a large portion of Iran’s emissions and its GHG position on the worldwide stage.
The source for market data and analysis in this article is FisherSolve™. Data tables behind Figures 1 – 11 can be obtained from Fisher International. E-mail requests to [email protected].


