As the global tissue leader re-structures its entire economy by turning inward, natural gas, faster machinery, TAD pilot scale experiments, integrated plants and expanded e-commerce are just part of its strategy.
China has taken the lead in tissue production, and total consumption in the last ten years. Because its per capita tissue consumption still lags behind more developed countries, it has the opportunity to continue to
lead the global tissue business for the foreseeable future. This will continue until India awakens to tissue growth or China’s soaring economic development stalls. Not only does China lead in tissue production, but also it will increasingly drive tissue equipment design and innovation in the future.
China has the world’s largest population at 1.379bn and the fifth largest physical area in the world (slightly smaller than the United States). Its population growth has slowed to about 0.41% (2017) compared with the United States at 0.81% (2017). However, China has over a billion more people than the United States. These people each consume one third to one-half of the tissue that an average American uses. China has a long way to grow before maturing to the slow tissue growth business stage we now see in North America, Japan, and Western Europe.
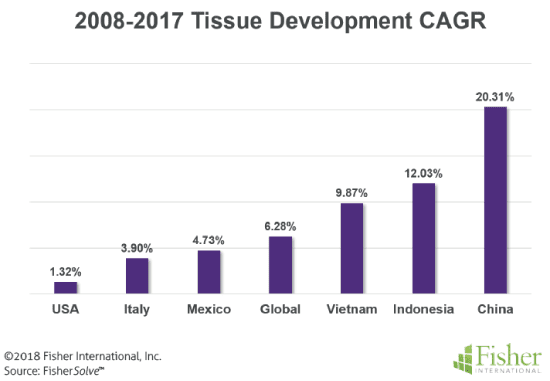
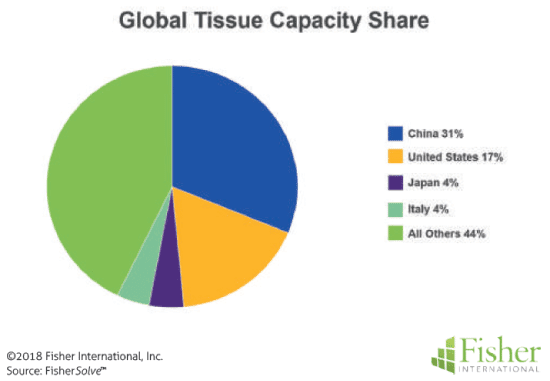
China is also diverse with different growth rates and characteristics. The southern coastal area has developed tissue manufacturing and consumption first, followed by the northern coastal region. Now we see the tissue production and consumption moving inland and to the western regions as well. Comparing global pulp and paper capacity growth in the last ten years to China helps put some of these numbers into perspective. 2008-2017 was a disastrous period for the worldwide pulp and paper business, and Figure 1 summarizes the global capacity trend. Global industry growth (CAGR) was 3.14% while tissue proceeded at 6.28% CAGR. However, while China’s paper industry grew at a remarkable 10.28% CAGR, the tissue grade portion had almost twice the growth rate at 20.31% CAGR. In contrast, the paper industry in the United States shrunk at -0.83% CAGR overall while tissue grew at 1.32%. China is now the leading tissue manufacturer with about 31% share by FMT (Finished Metric Tons) as shown in Figure 2. United States, Japan, and Italy shares are included to provide better visual perspective.
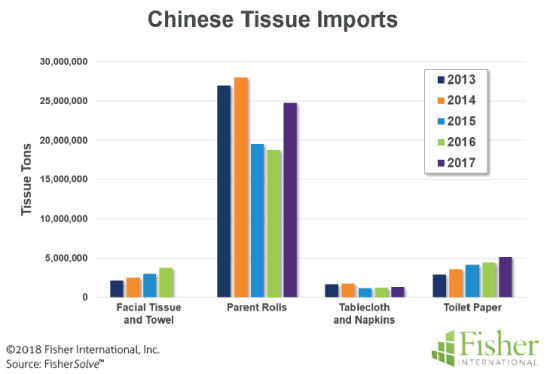
The remarkable evolution of the Chinese tissue industry is dependent mostly on the development of domestic consumption. China’s tissue business has a limited interaction in international trade as shown in the import and export Figures 3 and 4 derived from the UN World Trade database. China imports only about 0.2% of its tissue needs, and most of these tonnes are brought in as parent rolls.
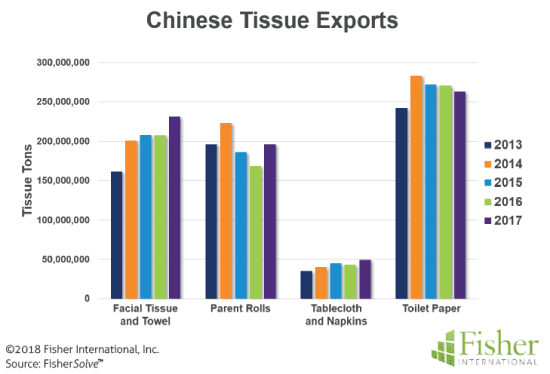
Exports account for only about 4% of China’s production. Converted facial tissue, towels, and toilet tissue exports are broader categories than parent rolls. Key importing partners for China’s tissue products are Australia, United States, Japan, Hong Kong, and Malaysia (Figure 5).
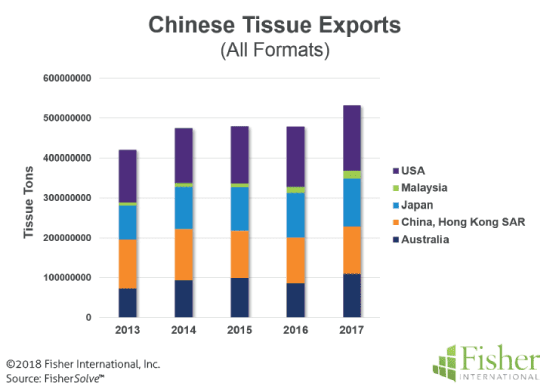
Despite the phenomenal tissue industry growth, there is still significant room for China’s tissue business to continue to grow based primarily on domestic demand. China has slowed its population growth, but the tissue consumption per capita continues to lag behind the developed tissue consuming regions of Western Europe, Japan, and the United States. China’s apparent tissue consumption was about 10kg per person in 2017, while the developed areas were consuming at nearly twice that rate. We don’t expect China will close that gap quickly, but it is reasonable to assume that the next ten years will see China approach 15kg per person consumption if the rate of economic growth continues. This change alone will add 50% to China’s consumption and, most likely, its production, and will ensure continued Chinese leadership ofthe tissue making business.
While China has the large numbers in tissue making and consumption, how does the quality of its processes compare to the rest of the world? Figure 6 illustrates the average tissue production cash costs for each producing country. China and the United States provide a direct comparison. China’s tissue production is now significantly greater than the United States, but the United States retains a cost advantage of less than US$100 per metric tonne at current conditions.
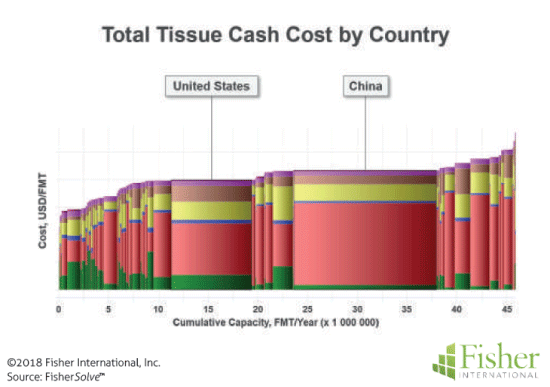
The reason for the cost advantage is evident from the chart details. The United States has a lower “Pulps Cost” (red bar colour). We will see in the next section that China does not use much recycled fibre for tissue making and tends to rely on purchased market pulp. The United States also has a noticeable “Raw Material Fibre Cost” (green bar colour) versus China. This indicates that there are more integrated virgin and recycled tissue mills versus China where integration is mostly limited to non-wood pulps.
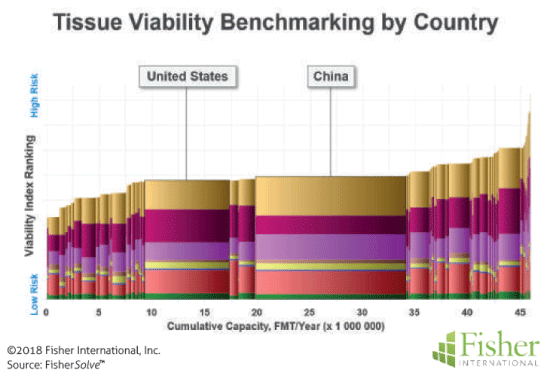
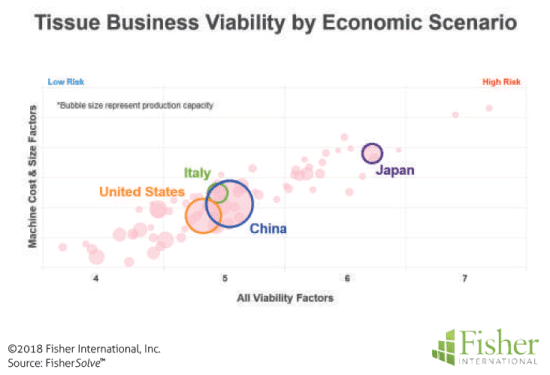
Figure 7 yields similar conclusions as both countries are in the middle of the pack. The United States risk is increased by the higher proportion of older equipment than China as shown in the red bar. However, China shows more risk due to the lower average capacity tons/ inch of width (gold bar colour). The bubble chart in Figure 8 holds the technical changes constant to compare each country’s tissue business only on economic risk due to potential currency fluctuations. Here we see that the United States again is similar to China, but slightly lower risk due to less currency risk for imported materials.
China uses much less recycled furnish in tissue making than most tissue producing countries. One reason for this is cultural and regulatory restrictions on the use of potentially contaminated recycled or recovered materials in tissue products for food or intimate contact. Figure 9 shows recycled fibre in specialty and industrial grades.
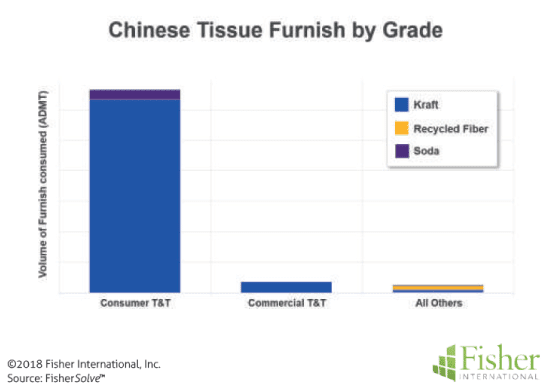
Although China uses very little of this fibre in tissue making, the effects are felt as increased worldwide prices for market pulp.
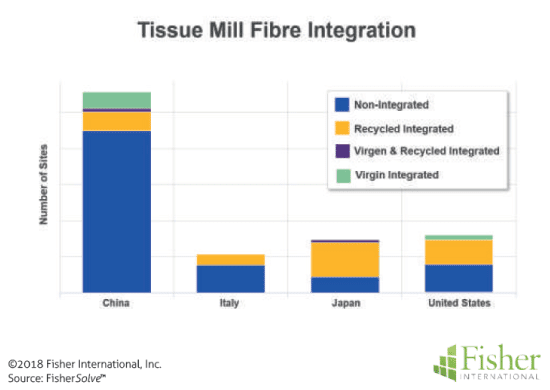
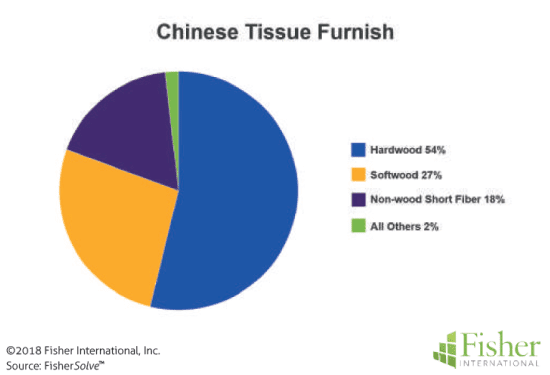
Figure 10 illustrates the United States cost advantage by comparing the number of integrated tissue mill sites at several top tissue producing countries. China has a low percentage of integrated sites compared to Italy, Japan or the United States. Therefore, China tissue production cost and viability are dependent on imported market pulp. As we can see in Figure 11, non-wood fibres such as straw and bamboo make up only 18% of China’s tissue furnish. This provides a starting point for making predictions for the future of China’s tissue business.
High fibre costs will continue to be a focus for China. We should expect continued efforts to secure supply lines for market pulp and develop internal non-wood pulp sources to ameliorate this cost and supply issue. China is already the leader of technology development for non-wood pulping with significant technical publications and new plants under construction.
Will China develop a consumer market like North America or Western Europe? Will the product formats and distribution follow the standard curve or will e-commerce distribution move ahead of retail and private label development? China is implementing e-commerce like North America. Anecdotal reports indicate that coastal cities see consumer interest in paper towels for kitchen use. Will these become a more significant part of the tissue product mix like North America?
Another question is technology adoption. China has many slower machines using steam heated hoods that limit production speeds. Will the new focus on natural gas imports allow the shutdown of coal steam plants and implementation of faster tissue machines?
If China continues to be tissue fibre limited, will advanced technologies that extend fibre performance at lower basis weights make sense?
Anecdotal evidence indicates that small-scale experiments with TAD pilot scale machines are underway. A final question is what is the expected rate of economic development expected for China in the next ten years? This analysis assumes that the China miracle will continue with only a slight moderation of the growth rate as the economy develops. A world embroiled in trade wars is only one scenario that could deflect from this course.
About Fisher International, Inc.
Fisher International supports the pulp and paper industry with business intelligence and strategy consulting. Fisher International’s rich databases, powerful analytics, and expert consultants are indispensable resources to the industry’s producers, suppliers, investors, and buyers worldwide. FisherSolve™ is the pulp and paper industry’s premier business intelligence resource. Complete and accurate, FisherSolve is unique in describing the assets and operations of every mill in the world (making 50 TPD or more), modeling the mass-energy balance of each, analysing their production costs, predicting their economic viability, and providing a wealth of information necessary for strategic planning and implementation. FisherSolve is a product of Fisher International, Inc. For more information visit: www.fisheri.com or email info@fisheri.com USA: +1-203-854-5390


