


The French tissue business does not have as long a history as the United States or Germany, but it continues to be unique in tissue product flair and operations. From yellow vests to ubiquitous pink toilet paper, France continues to set its own style. One of the major production differences is the nuclear electric power generation which will be discussed later.
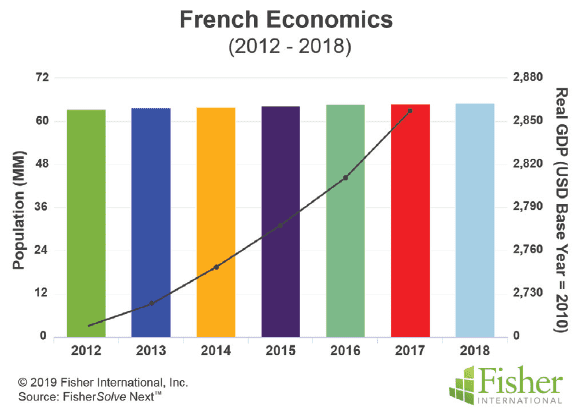
Despite being a major economic power in Europe, France has not enjoyed the strong, export-driven economy that countries such as Germany – which is the continent’s largest national economy – has. Its population growth has been noticeably flat (Figure 1). Population growth expressed as cumulative average growth rate (CAGR) from 2012 to 2018 was 0.5% compared to 1% for a similar period in Germany. However, France’s economy grew more slowly than Germany. The GDP index line in Figure 1 shows a CAGR of 1.4 % versus 2% CAGR in Germany over a similar period, and small differences at this end of the scale are noteworthy.
France has experienced a significantly higher unemployment rate, peaking at 10.4% in 2015 (Figure 2). This is about twice the unemployment rate experienced in Germany over the same period. Figure 2 shows French unemployment trending down below 9% in 2018, but the cost of living made a jump in 2017.
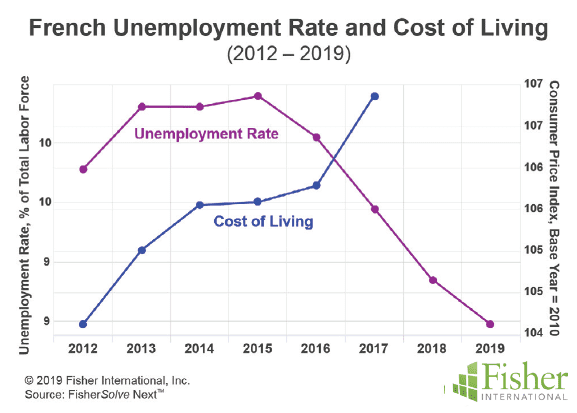
This progress on unemployment is good but still almost double Germany’s
results. The steep increase in the cost of living as employment improved is a worrying trend that appears to be reflected in widespread protests.
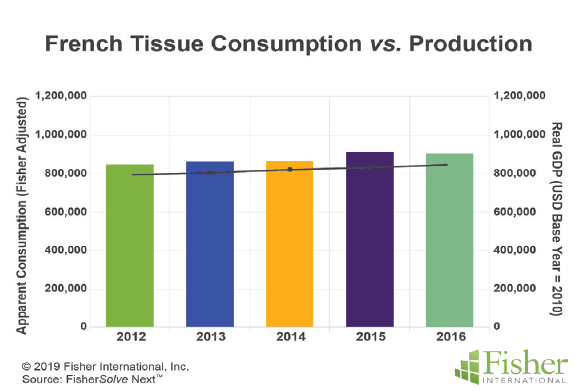
Figure 3 shows that France is generally in balance between production (chart line) and consumption (represented by the bars). France imports about 7% of its overall tissue requirements, and its total consumption of tissue at about 14kg per capita is somewhat lower than Germany, the United Kingdom, or the Nordic countries, but otherwise similar to the rest of western Europe. This indicates that there is room for France’s tissue business to grow organically despite the prolonged population growth if supported by product use habits and the overall economy.
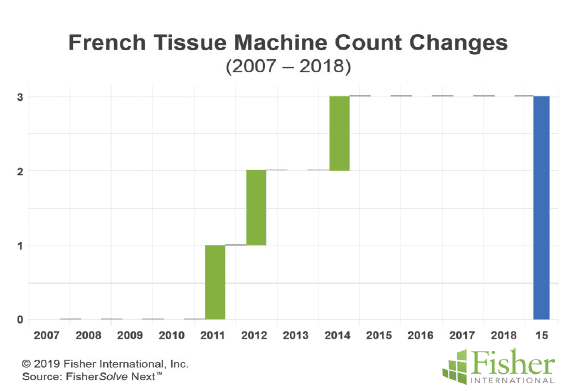
France’s slow growth in population and the economy have only supported the addition of three new tissue machines in the period 2007 to 2018, but there are indications of a potential new project announcement in 2019. Figure 4 shows the timeline of the French tissue machines coming online.
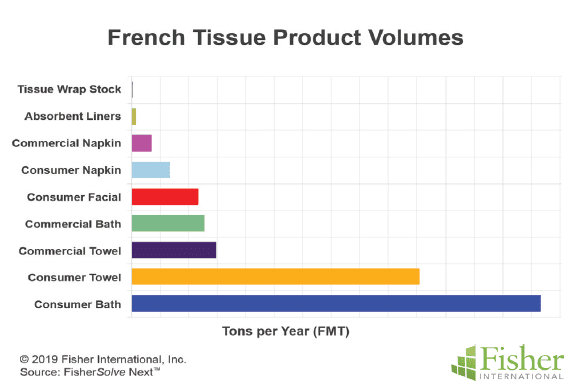
France’s relative volume of tissue products is shown in Figure 5. As expected, consumer bath, or toilet paper, makes up the overwhelming volume share, followed by consumer towels. Facial tissue is a robust sector with much higher use of packet pack formats than North America. France also has a smaller but healthy commercial or AfH tissue business.
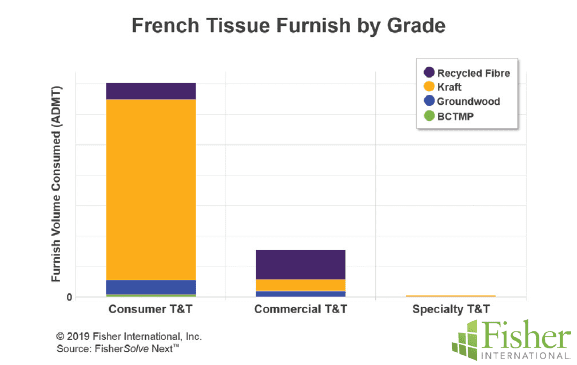
French tissue makers purchase most of their fibre furnish. The consumer tissue grade is almost all purchased fibre as shown in Figure 6. Commercial tissue consumes a larger percentage of internally generated deinked furnish. Specialty tissue is mostly purchased fibre.

Most of French tissue production is based on purchased kraft pulp. Figure 7 shows the relative volumes of kraft hardwood/ softwood to the deinked and other non-deinked pulps for each tissue grade. It is interesting to see a little BCTMP used in both consumer and specialty tissue grades.
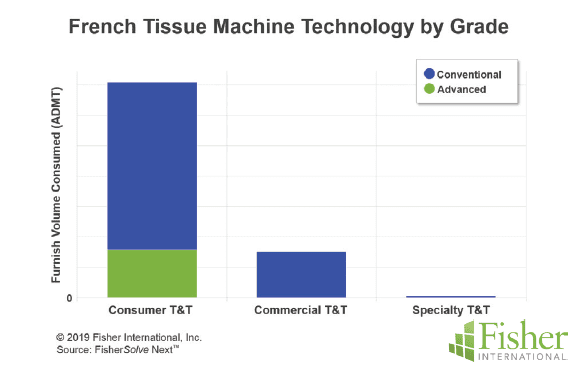
French tissue production includes structured technology such as Through Air-Drying (TAD) as shown in Figure 8. The advanced technology is focused on the consumer grade, especially kitchen roll towels. Advanced technology does not play a role in the commercial grade, unlike North America where it has growing application in high-end washroom hand towels.
A group of eight other European countries were chosen to provide a comparison of the French tissue business to neighbouring and in some cases similarly sized tissue producers.
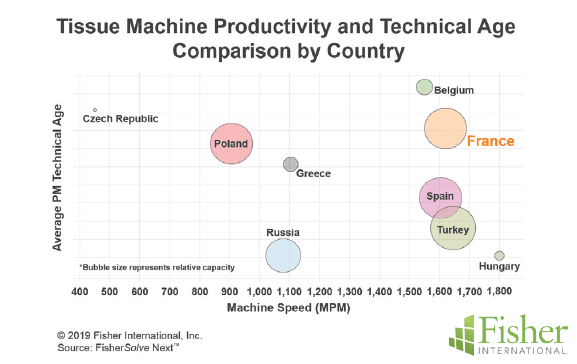
Figure 9 provides a contrast of average machine technical age and average machine speed for each country. The size of the bubbles represents the tissue production capacity of each country. France is a similarly sized tissue business to Poland, Spain, and Turkey. Belgium, Hungary, Greece, Czech Republic, and Russia are all somewhat smaller tissue producers. The chart shows that France has a relatively high average technical age for its tissue machines, but they are currently achieving high-speed production.
The relative country average cost per tonne position for the same set of eight references and France is shown in Figure 10. France is in a relatively high-cost position compared to the other larger producers in the set. Russia is in a position to have low cost fibre sources. However, the other larger producers import mostly market pulp like France. Digging deeper into the cost differences, labour costs per tonne are significantly higher in France than in the other countries compared here. Only Belgium comes close to France’s labour costs.
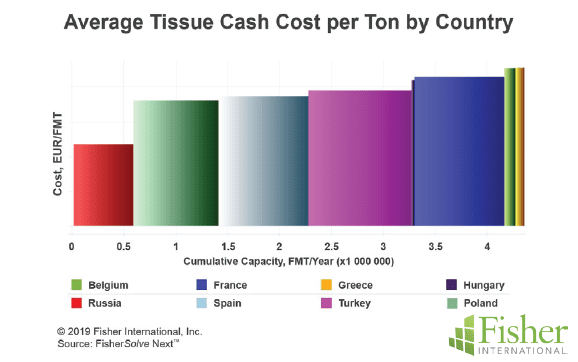
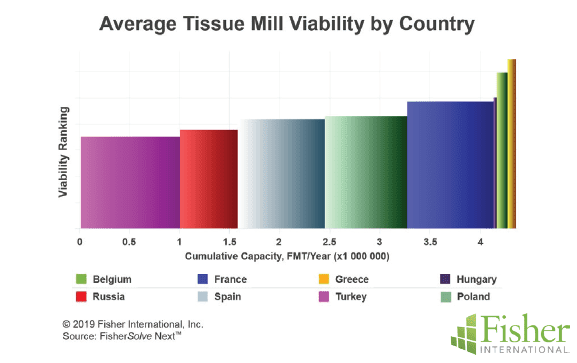
Figure 11 shows the viability rating for France against the same set of reference countries. Similar to the cost chart in Figure 10, France comes out with slightly higher risk than the other larger producers. The key factors that increase France’s risk rating are the higher costs and older machine technical age.
Sustainability has become a critical social and political concern in Europe. Water consumption and average water risk are plotted in Figure 12. In this bubble chart, the size of the bubble again represents the relative capacity of each country’s tissue business. The X-axis shows the average water consumption per ton of tissue produced. The Y-axis shows the FisherSolve Next water risk index for future availability. All reference countries, except Russia, had low-water consumption per tonne of tissue produced compared to North America. Minimising water consumption requires both operational discipline and capital investment.
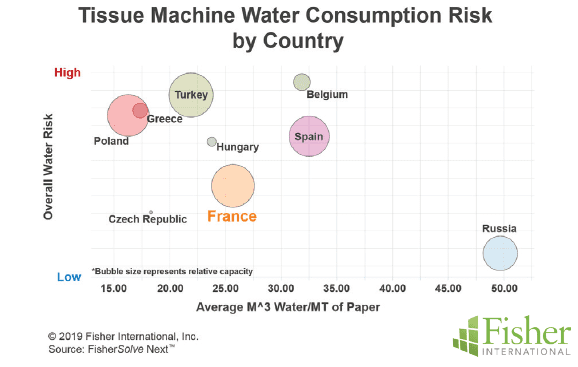
Most European countries tend to lead the global tissue industry in this sustainability factor. France has a relatively low water risk ranking. Comparing countrywide averages for water risk can overlook significant local factors, but France looks well positioned for water sources in the future.
For overall energy consumption, Figure 13 shows that France consumes a significant amount of energy in its tissue production. However, this doesn’t tell the whole story. France has low carbon emission nuclear electrical energy and the cost of this electrical energy is only slightly higher than the other large producers. The cost of fuel and steam in France is relatively high for Europe.
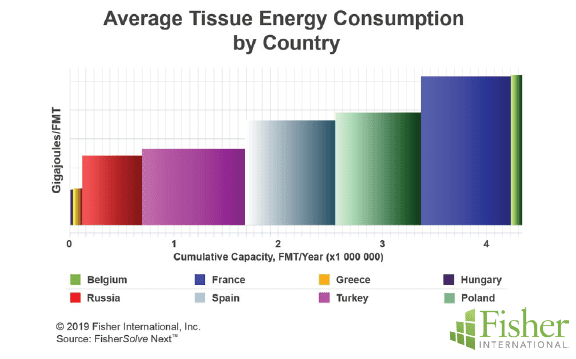
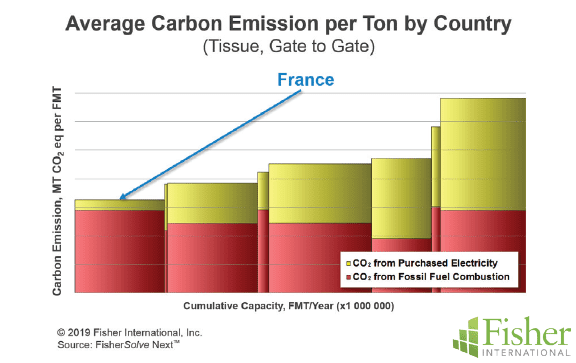
Figure 14 shows the country average tissue carbon emissions per tonne, calculated on a gate-to-gate basis. That basis excludes carbon emissions resulting from producing fibre that is shipped into the mills. Here we see that France is the lowest carbon emitter in the set due to the low average carbon content of its mostly nuclear power plants. If carbon emissions
become a significant cost or marketability factor, France is exceptionally well positioned at this point.
In conclusion, France’s tissue business is reasonably competitive and positioned for the immediate future. Its tissue production is focused on the domestic market with small amounts of imports to balance consumption with production.
Tissue making capacity has kept up with the slower population and demand growth. French tissue machines are fast but have a higher technical age compared to their reference set.
The country has several advanced tissue technology machines, including TAD. These are applied to produce superior consumer towels (kitchen rolls). There is also low water risk and low water consumption compared to peers. French tissue energy consumption is average for Europe, but costs of fuel and steam are on the high side of the reference set. Carbon emissions are very low due to the high percentage of nuclear power generated electricity. However, France’s government has announced plans to eliminate nuclear power over the long term. This move is applauded by neighbours like Germany but also at odds with reducing carbon emissions and global warming.
The question is how France will position its energy sources and costs in the post-nuclear and carbon neutral future expressed in its goals? Labour costs are higher than in Germany and the comparison country set selected for this report. Combined with the increasing consumer inflation, this is one of the sources of labour unrest expressed in current protests.
This analysis used industry averages by country for comparisons and there is considerable variation within France as well as within any country’s population of tissue machines. Strategic plans depend on details; it’s important to look closely at individual companies, mills, and machines when predicting future actions.
This article presented a static picture summary; France is currently experiencing demonstrations expressing frustration with the economic factors of unemployment and consumer price inflation. The net results are unclear at this point. Fibre prices, exchange rates and environmental regulations will change, giving some participants advantages and others difficulties; tissue companies will continue to change hands and perhaps consolidate; neighbouring countries may invest in tissue making capacity, affecting France’s imports; consumer preferences will continue to evolve, making TAD either more critical or less – and future pulp and energy prices will change TAD adoption, too.
About Fisher International, Inc.
Fisher International, by virtue of its deep expertise in the pulp and paper industry, provides insights, intelligence, benchmarking, and modeling across myriad scenarios. By arming companies with the knowledge that will help them gain a better understanding of their strengths and help identify weaknesses, Fisher is helping businesses stave off challenges and better position themselves for long-term growth. For more information, visit www.
fisheri.com, email [email protected] or call +1 203.854.5390 (USA)


