Last year Fisher International gave a presentation on “Issues Keeping Tissue Executives
Up at Night,” in which it was suggested that pulp prices and tissue mill integration, e-commerce, new technology and capacity, and sustainability were significant disruptors to tissue manufacturers in several regions of the world. In less than a year, fibre prices have changed course, but the other disruptors continue. How is this playing out in the United States tissue business, and should its executives be sleeping soundly?
The United States can be considered the home of the modern tissue business by several standards. The USA tissue market (Philadelphia, Pennsylvania) was the origin of Scott® tissue in the roll format now used around the world. Creped wadding was developed in Neenah Wisconsin for bandages in World War I. This led to Kleenex®, which was first established as a makeup remover and then as facial tissue, and Northern® bath tissue (Green Bay), the first “no splinter” brand without mechanical pulp. Charmin® bath tissue (Green Bay) was the first brand to use through air drying (TAD).
Today, Americans use about 25kg per person in a year, the most tissue per person of any country in the world. Significant company research continues for branded product differentiation, however, there is no longer any supplier of new tissue machines located in the United States, and Yankee dryer production in the USA stopped 50 years ago. It is interesting to consider that the country with the most advanced tissue machines and intensive tissue consumption no longer manufactures or develops sophisticated tissue making equipment.
The country has enjoyed a remarkable long-term recovery since the great recession of 2007. GDP growth has been slow but improving while
inflation continues to be very low. The unemployment rate has declined steadily and has now reached all-time lows, while the 2018 population growth was 0.8% due to low birth rates and lower immigration compared to similar countries such as Canada. Similar to Europe and Japan, the United States population is aging, and this can be expected to shape tissue demand in the future. Now global trade restrictions and the age of the current economic expansion have added to the economic headwinds from the United States maturing population.
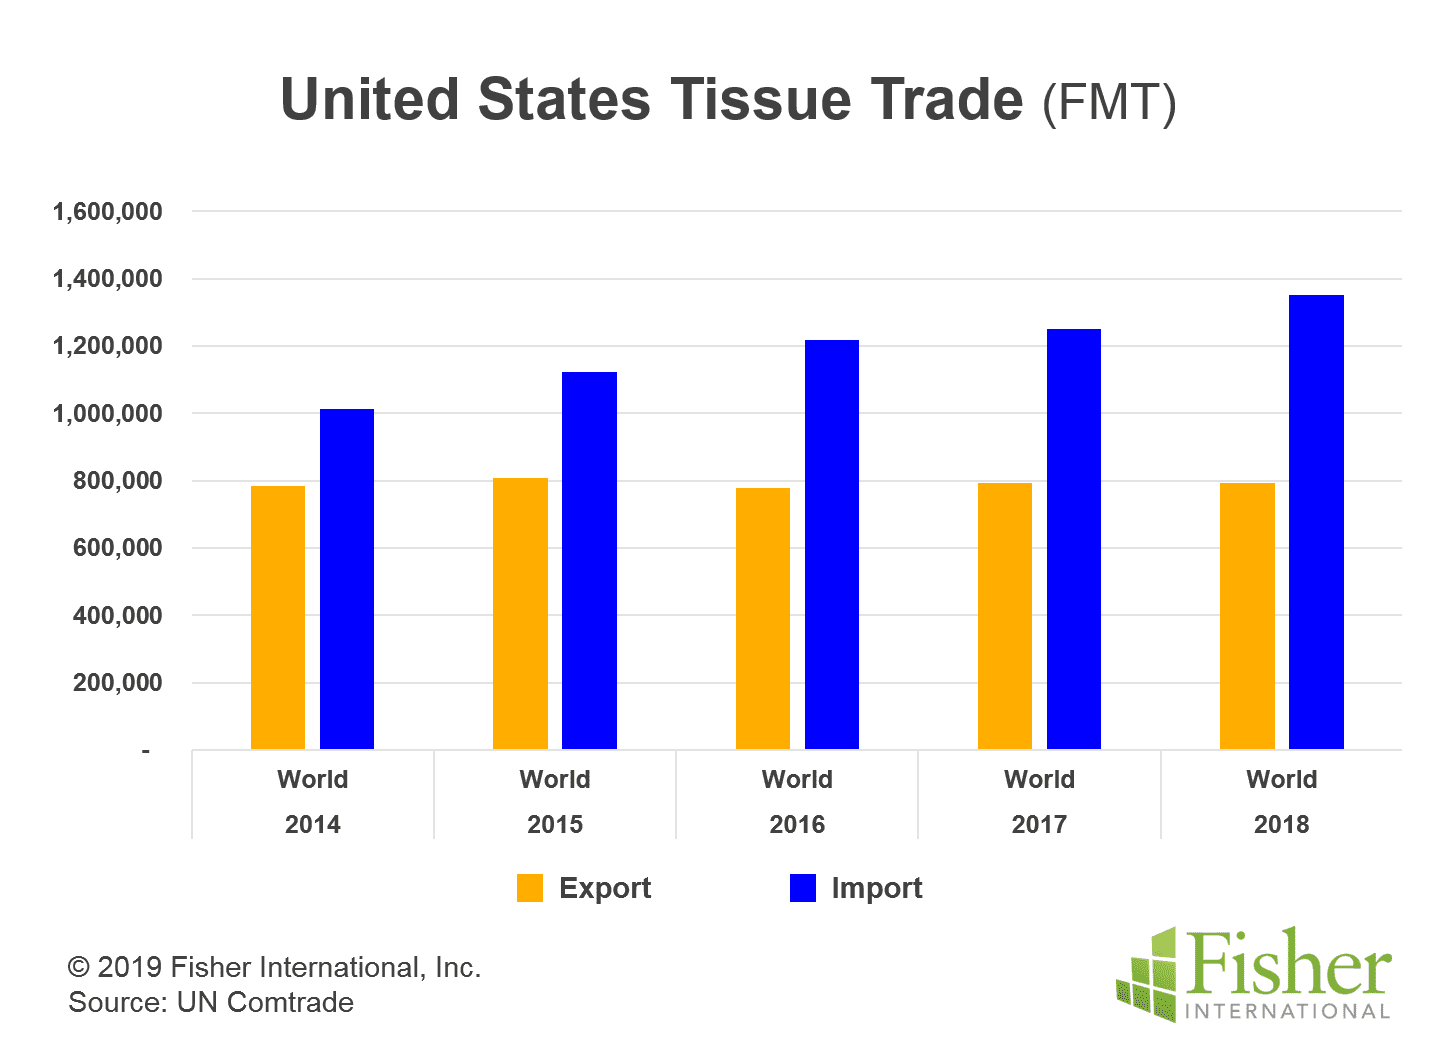
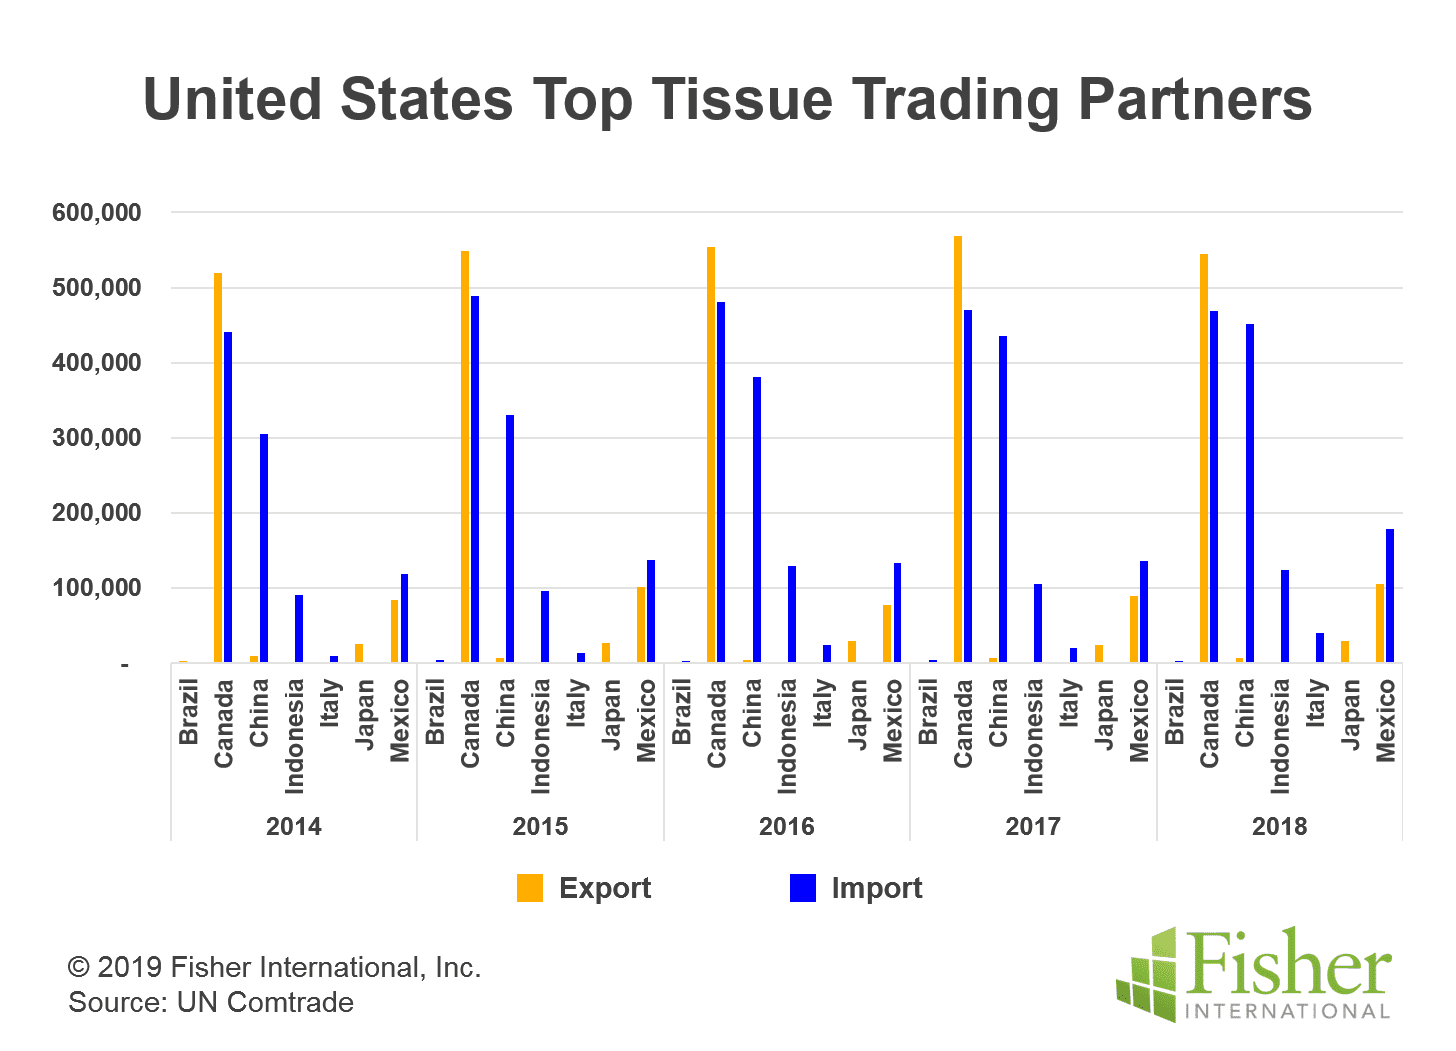
Figure 1 shows the five-year development of the United States global tissue trade business. Tissue imports, including parent roles and converted products, have been steady at less than 10% of total domestic capacity. However, tissue imports have been growing and could reach two times the level of exports in the next two to three years if this trend continues. Figure 2 shows the top seven trade partners that make up the vast majority of all United States tissue trade. Canada has the largest share with an essentially balanced trade. Imports from China have proliferated in the past five years and now are almost equal to imports from Canada. Mexico’s tissue trade is two- way, like that of Canada, and imports from Indonesia are growing. The new Brazilian tissue capacity has not shown up on the 2018 UN Comtrade data.
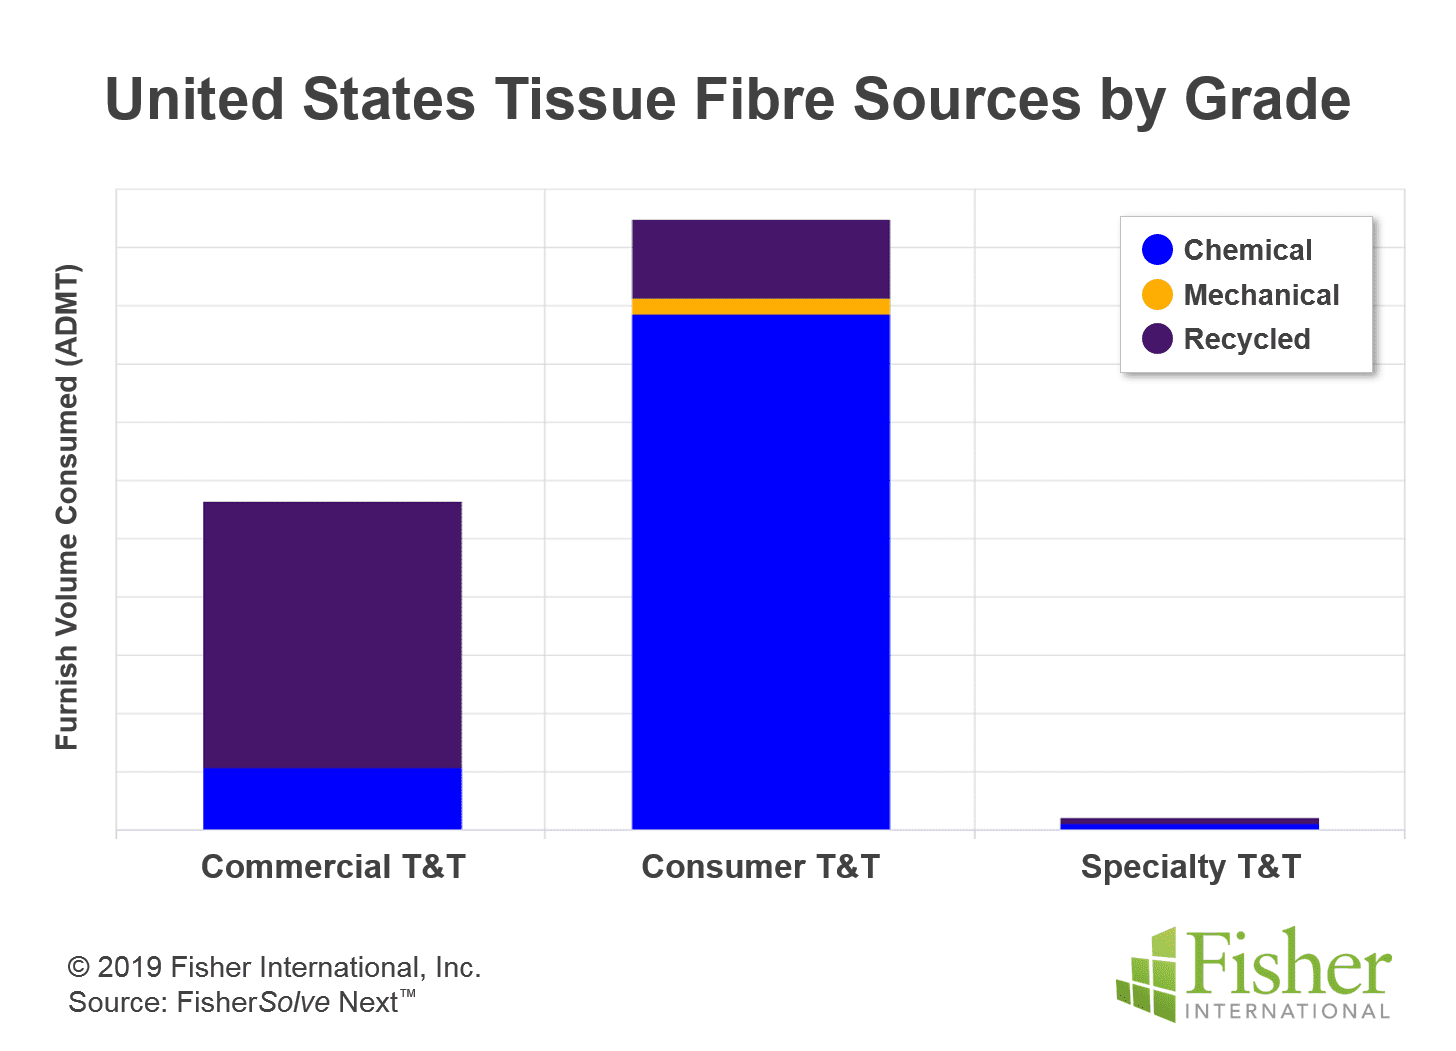
The United States tissue fibre sources are shown in Figure 3, and 37% of the total tissue furnish is from recycled paper. This is not surprising as the commercial or AfH tissue business is primarily supplied with recycled fibre to meet government bid requirements. The consumer or at-home tissue market consumes much less recycled fibre. The small amount of mechanical fibre shown can include BCTMP used in towels to build bulk and absorbency. The United States tissue business has the highest degree of fibre integration with virgin pulp production of any developed country.
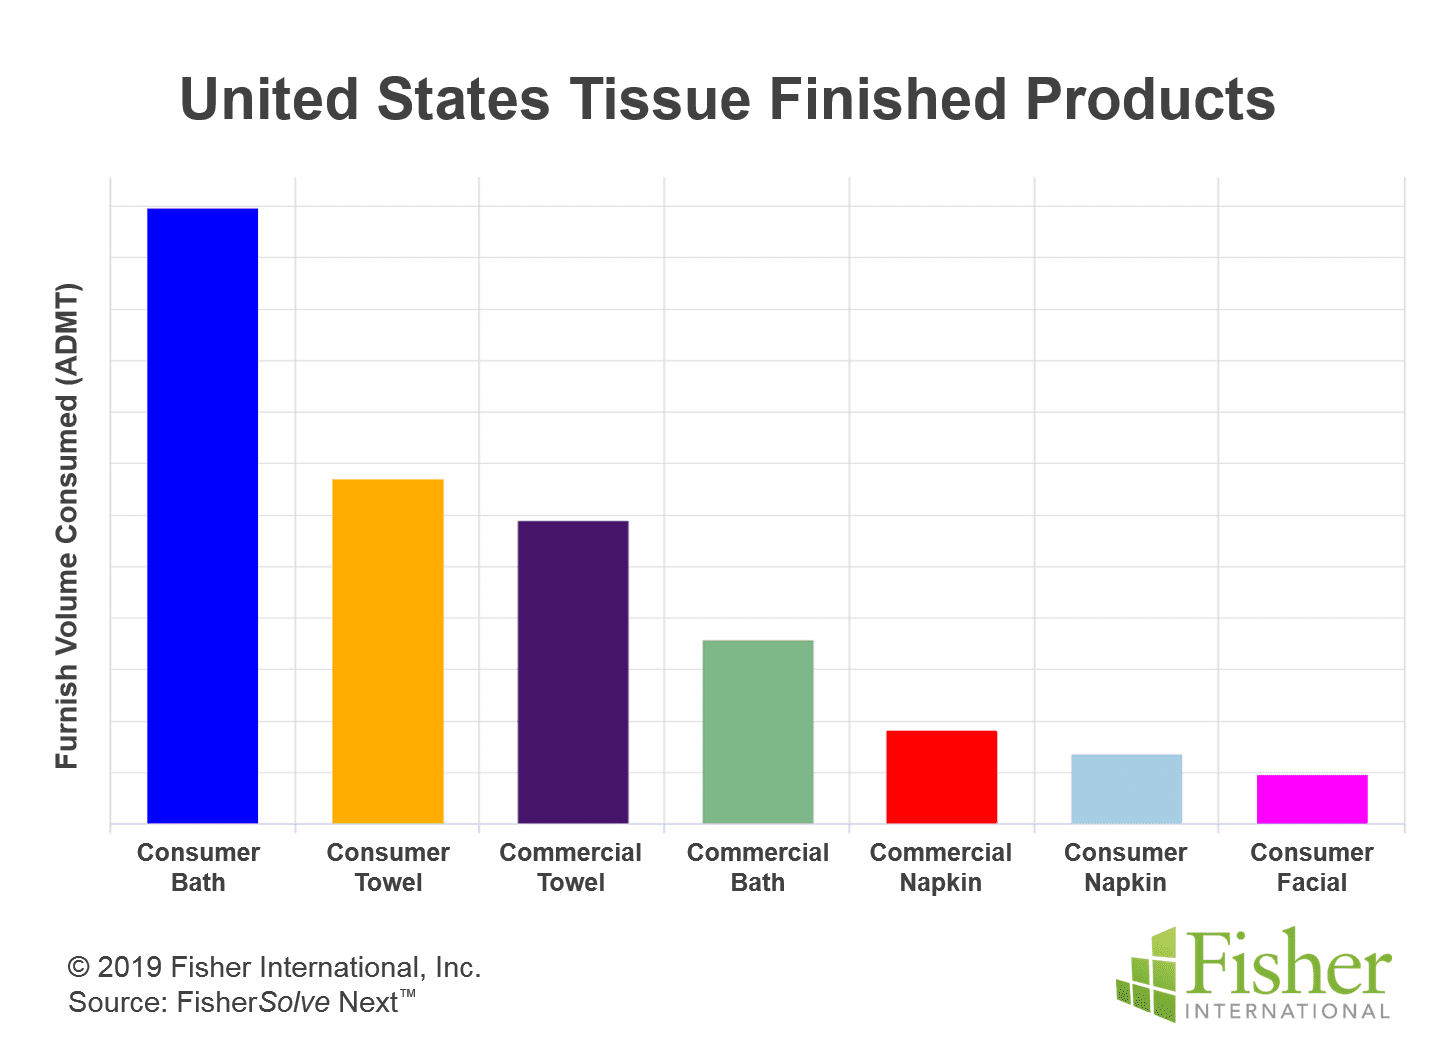
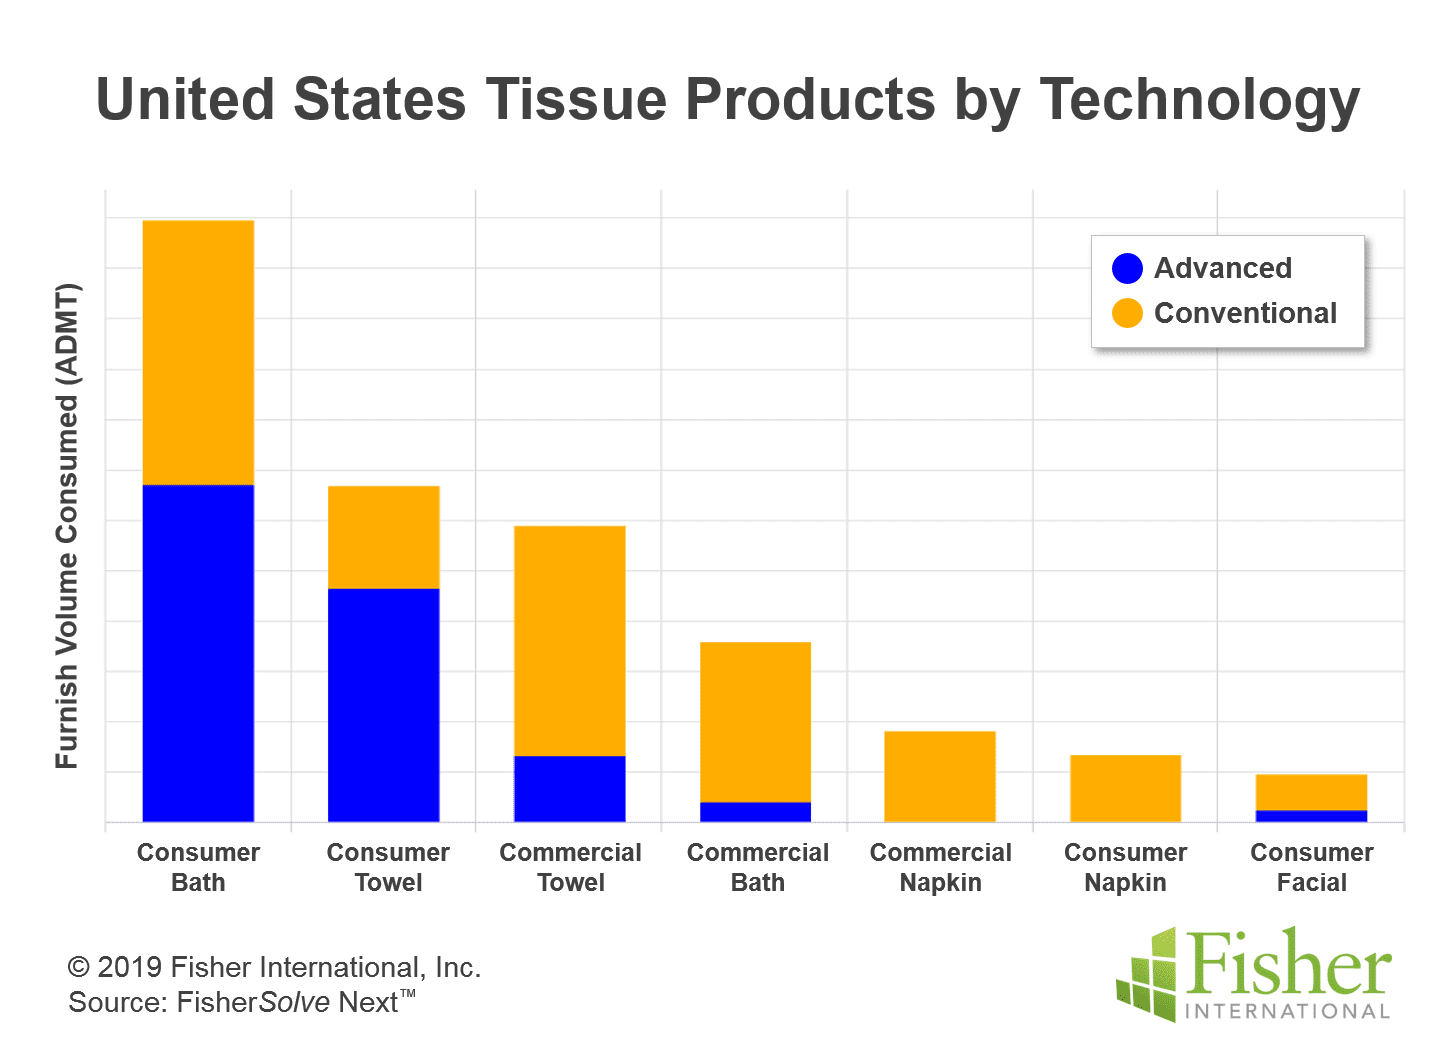
Figure 4 shows the relative size of tissue finished product categories. Consumer bath tissue and kitchen roll towels are the most significant categories, closely followed by commercial and towels. It’s worth noting that the United States has the world’s most developed commercial tissue business. This represents more than 30% of the total tissue consumption and contributes to the high per capita usage reported. It also makes USA tissue demand more closely tied to the economy and travel habits of the population than merely consumer tissue. About 41% of tissue machines in
the United States use advanced tissue technology. The majority of these are TAD, but also include ATMOS, NTT or QRT, and eTAD. Figure 5 shows the deployment
of these technologies by product group. Consumer bath has the most extensive
use of advanced technologies followed
by consumer kitchen roll towel. Advanced technology appears to be a clear winner for consumer towel production, but commercial towels are also seeing increased use of advanced technology.
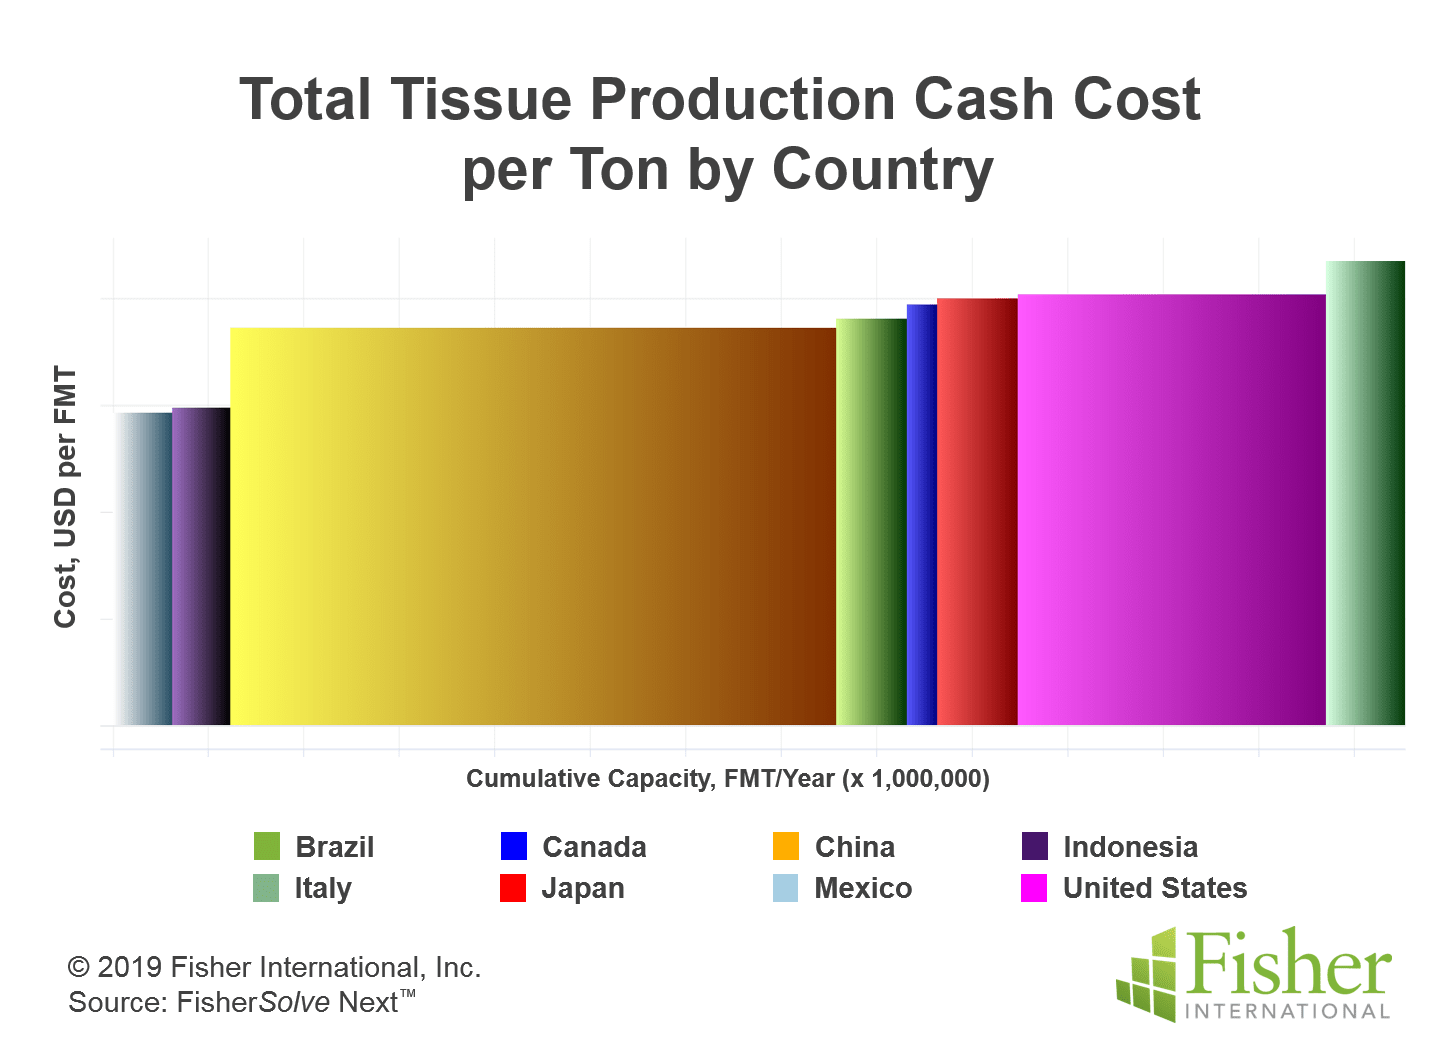
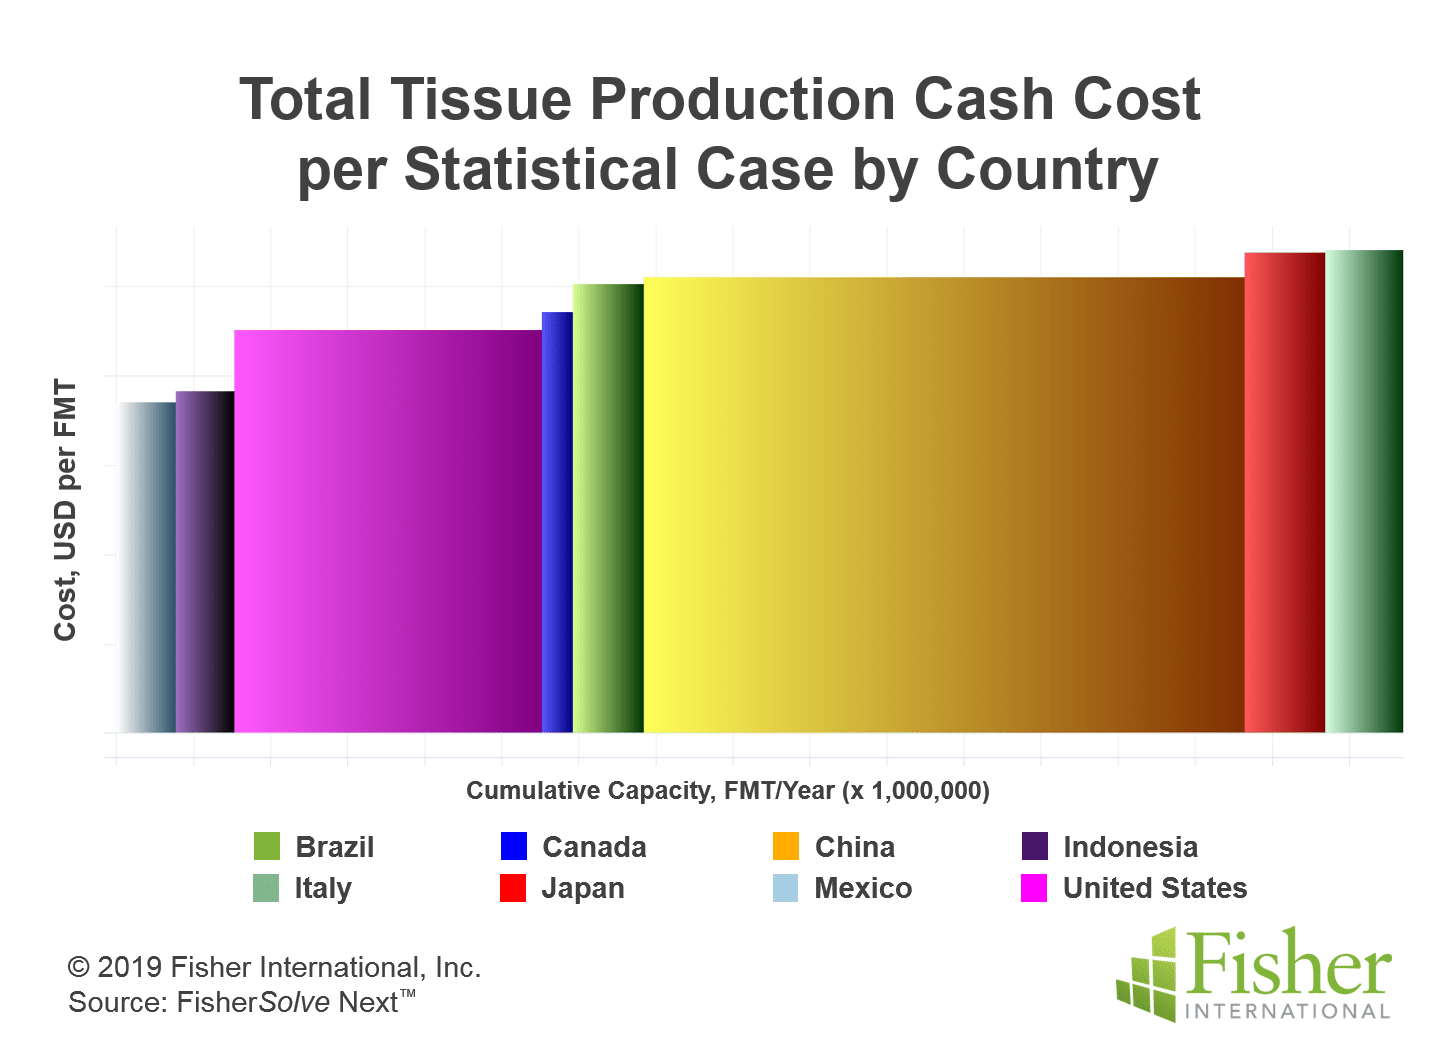
Figure 6 and 7 help illustrate the impact of advanced technology on fibre consumption. Figure 6 shows the United
States tissue manufacturing cost versus its seven closest trading partners. Indonesia and Mexico have somewhat lower costs per tonne of tissue production, but the United States position is similar to most of the others.
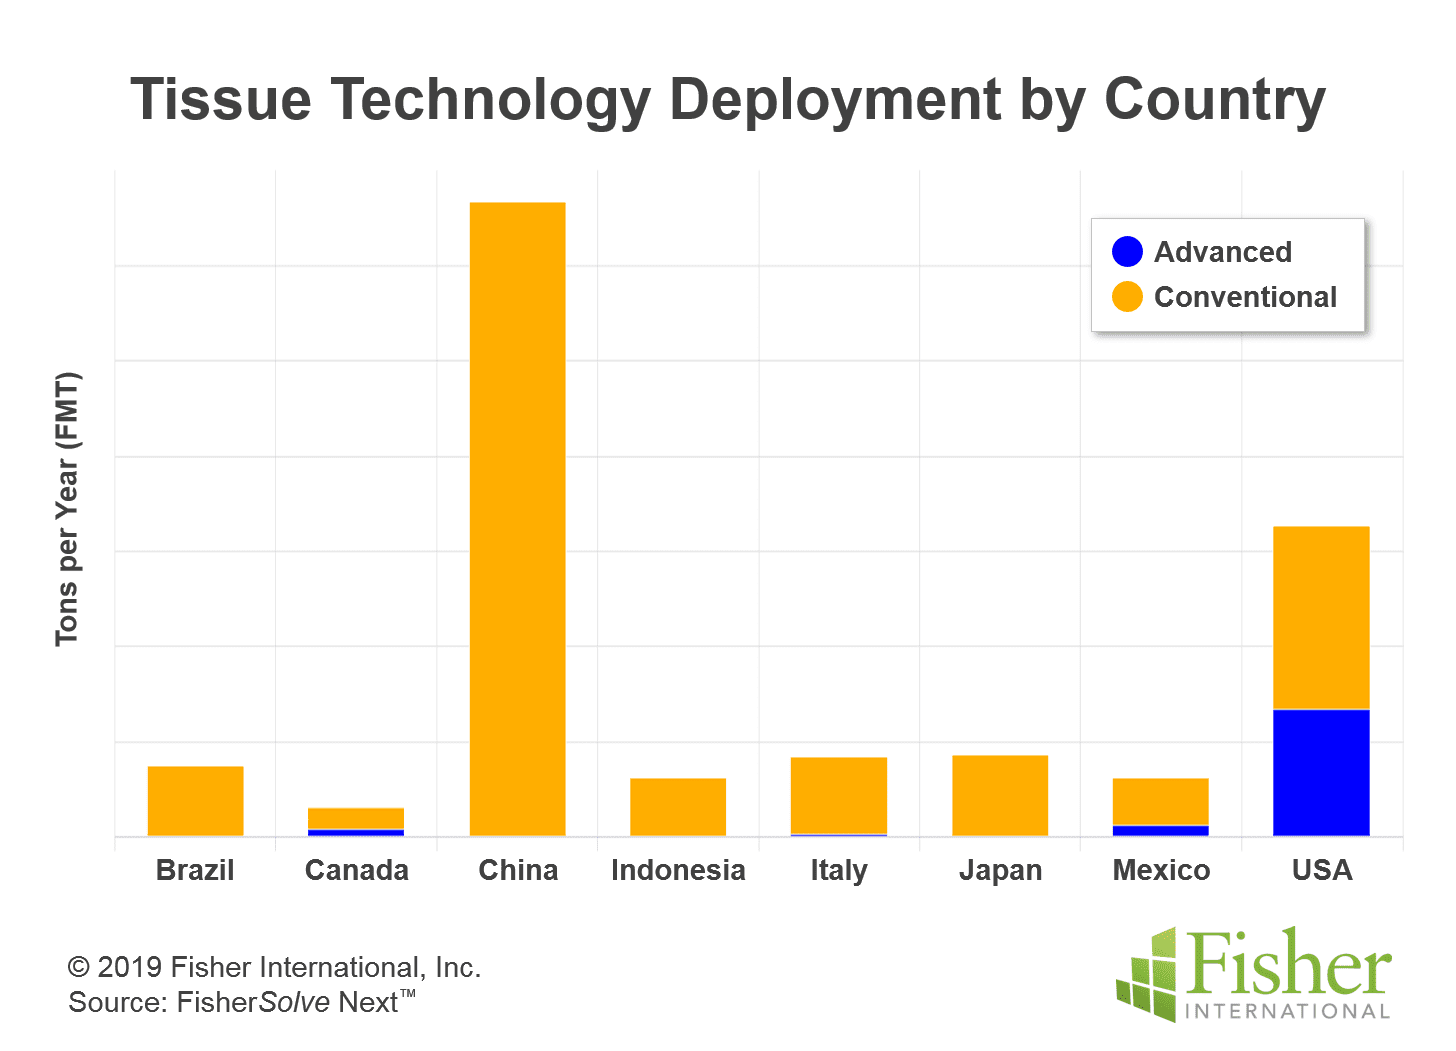
However, taking advanced technology’s effect on basis weight at equivalent performance into account, American tissue producer’s cost becomes more competitive when shown on a statistical case basis (Figure 7). Figure 8 shows that only Mexico and Canada have significant deployments of advanced technology machines to take advantage of this effect.
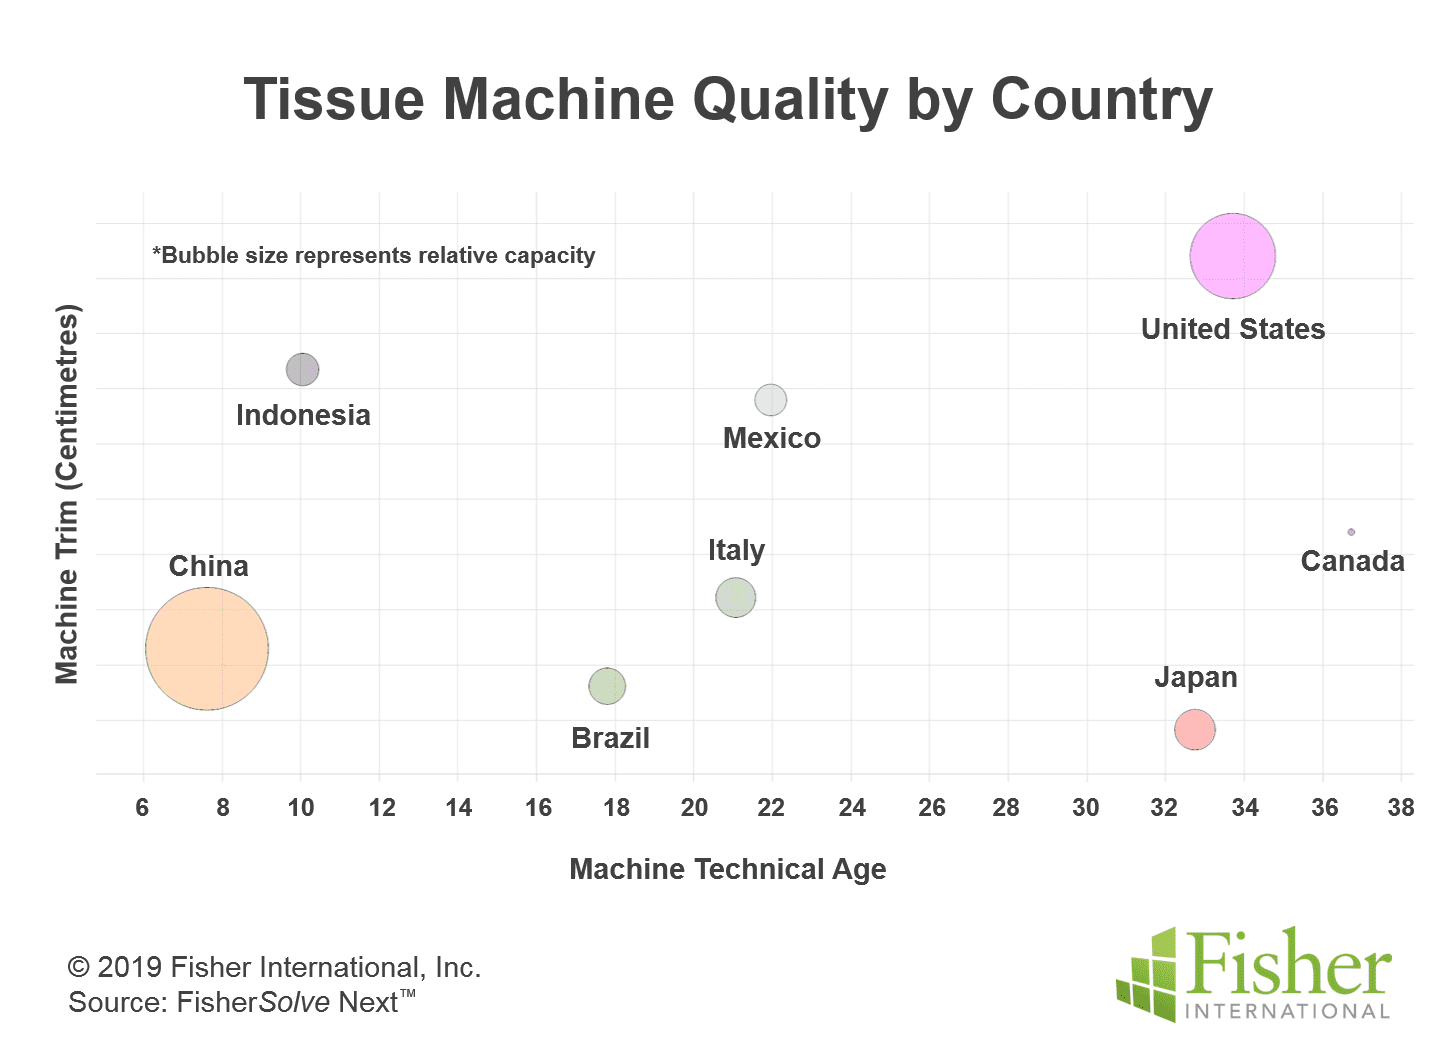
Figure 9 provides a comparison of tissue machine quality among the United States tissue trade partners. The average tissue machine technical age is shown on the x-axis while the average tissue machine trim is the y-axis. The size of each bubble represents the country’s relative tissue capacity.
Indonesia and China have by far the newest tissue machines, but they are also relatively narrow. The United States, Canada, and Japan have the oldest machines, but the United States has by far the widest machine average in the group. This suggests that the average productivity of the machines should be relatively high.
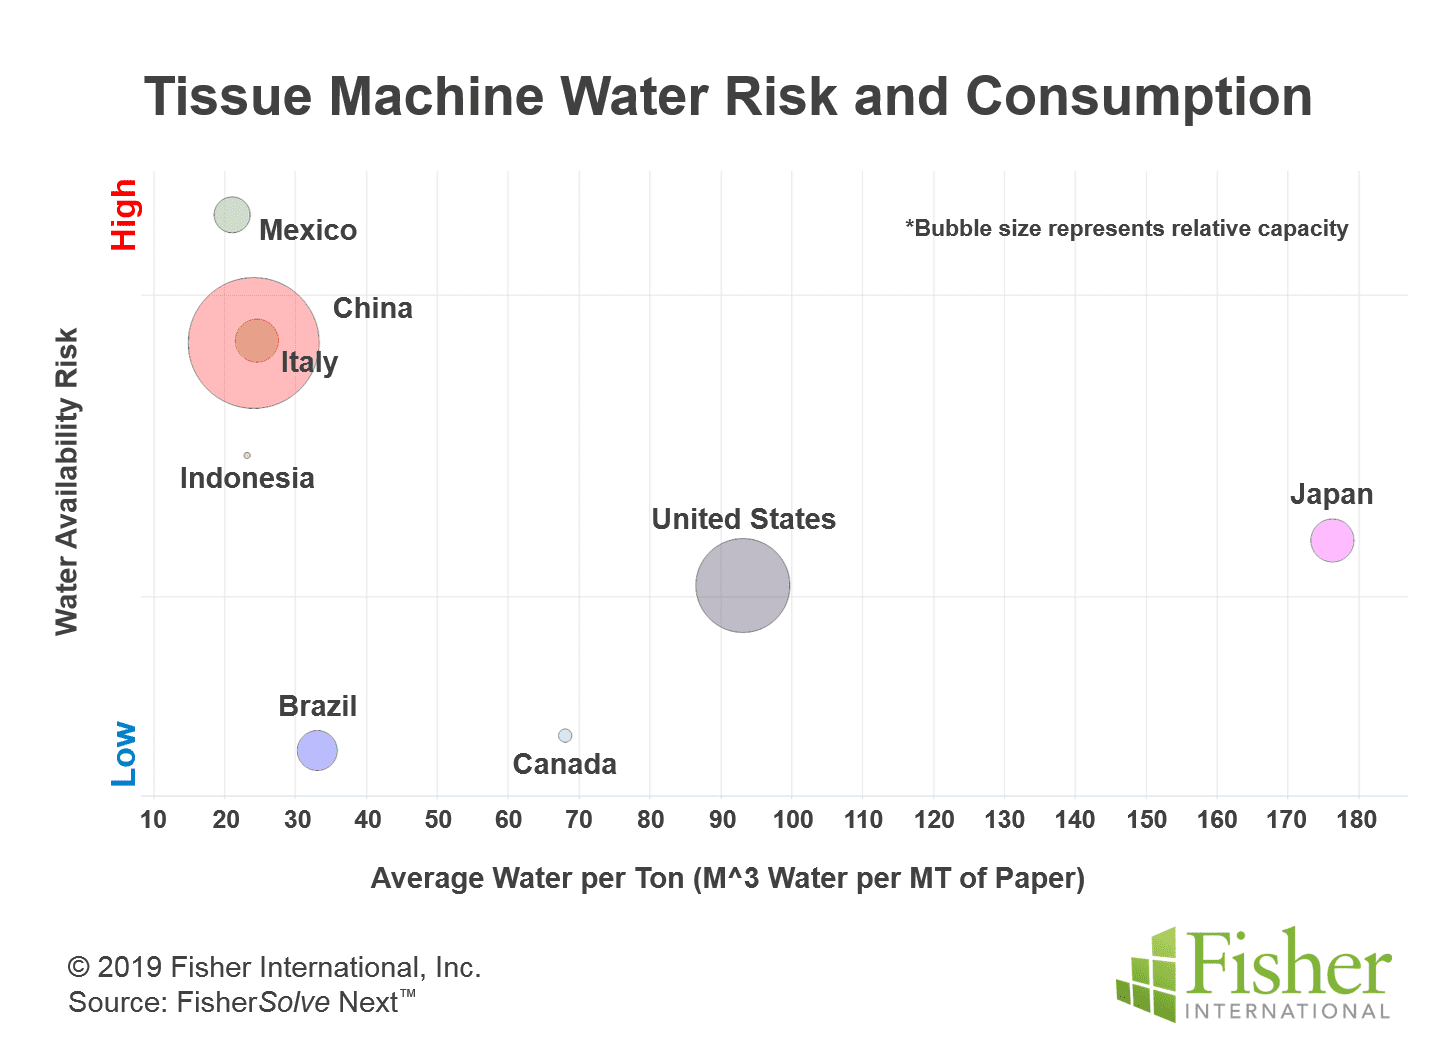
Figure 10 provides a comparison of the use of water and water risk for each of the trade partners. The x-axis represents the average water consumption per tonne of each tissue machine, and the y-axis represents the average water availability risk.
Brazil, Canada, the United States, and Japan all have relatively low water availability risk. Mexico, China, Italy, and Indonesia all have higher water risks. All water risk is local, and country averages should be examined by region if the country encompasses several geographic areas.
Canada, Japan, and the United States all have higher than average water consumption. With low water availability risk, the main issue is the potential to close up the mill and save on water expense.
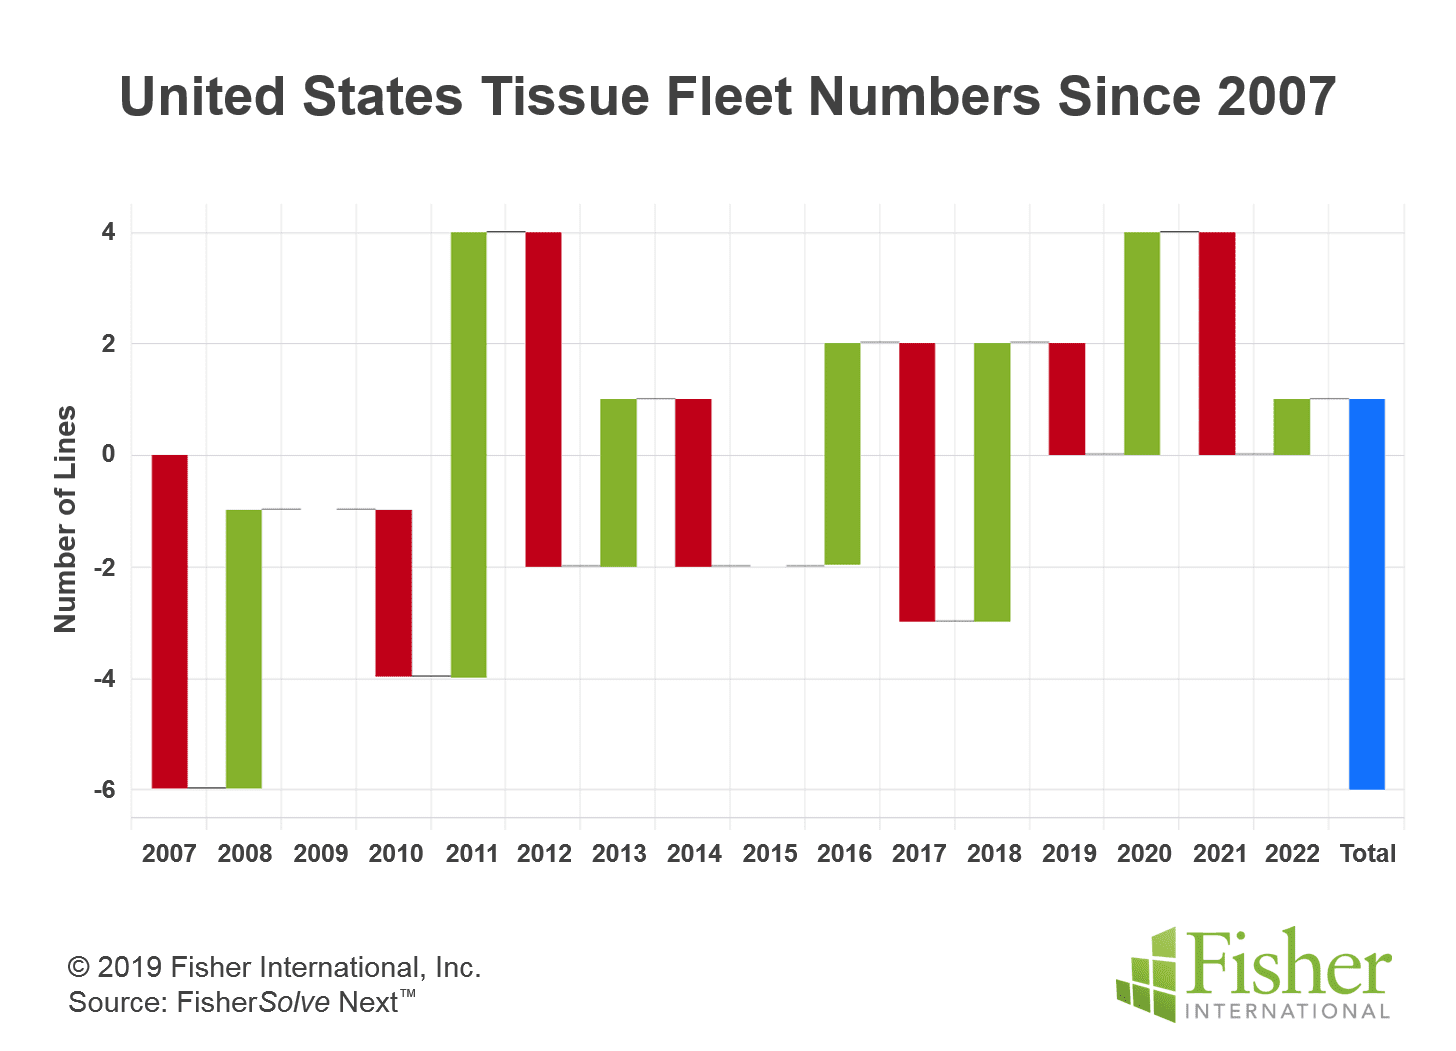
The number of companies involved in United States tissue manufacturing has increased significantly in the last 15 years. Many new mills, tissue machines, and new capabilities are now operating. Private label tissue now accounts for more than 30% of the total consumer tissue volume in the United States. Most producers of branded tissue products have reduced or maintained capacity resulting in a loss of market share. Figure 11 shows the change in the number of tissue lines since 2007. There’s been much activity and new companies involved, but the overall number of tissue lines operating has not increased as much as a casual review of the News might suggest. Through 2022, the forecast is for a net reduction of seven tissue lines since 2007. Of course, the new lines are considerably faster and perhaps wider than the lines removed. Whether the American tissue market has been overbuilt or underbuilt depends on the assumptions made in forecasting market direction.
The United States tissue business has undergone significant change with many new manufacturing companies stepping in, increased consumer private labels, new technologies in addition to TAD, and a whipsaw of virgin pulp and recovered paper pricing recently due to changes in China’s furnished sourcing. It appears that overall tissue capacity has increased at about the same rate as the population. However, the future seems somewhat unclear. This analysis has raised as many questions as it answered. Will the United States economy and consumer culture continue to support the world’s highest per capita tissue consumption? Has the consumption rate topped out, or is there room for increased penetration into toweling or other discretionary uses? It is certainly possible to make a case that American consumer behaviour could regress to the mean of the different advanced countries consumption rates if a social focus changed to using less disposable items and sustainability. However, it’s also possible to project that increased interest in sanitation and disease control could drive both commercial hand towel and consumer towel consumption further. The fragmentation of branding has resulted in increased short sheeting and narrow rolls.
Could this have made a one-time change reducing basis weight per consumer use
that will not repeat? It’s possible to imagine both higher and lower consumption rates. American tissue manufacturers just passed through a period of very high virgin pulp pricing and corresponding low recovered paper costs. Will this change the mix of fibre sourcing for both new mills and rebuilds? Will the interest in non-wood pulp sourcing grow? Will an increased interest in sustainability result in more energy efficiency measures such as cogeneration? Is there a future for high energy consumption TAD that now makes up such a large percentage of the capacity? Will the advanced alternative structured technologies replace TAD? Could e-commerce start to grow fast enough to disrupt branded and private labels sold in stores? American tissue manufacturers will be looking for answers to all of these questions.
About Fisher International, Inc.
Fisher International, by virtue of its deep expertise in the pulp and paper industry, provides insights, intelligence, benchmarking, and modeling across myriad scenarios. By arming companies with the knowledge that will help them gain a better understanding of their strengths and help identify weaknesses, Fisher is helping businesses stave off challenges and better position themselves for long-term growth. For more information, visit www.fisheri.com, email [email protected] or call +1 203.854.5390 (USA)


