


By Bill Burns, Senior Consultant, Fisher International
Japan, the most developed country in Asia, is the quintessential definition of an economic miracle emerging from the defeat and economic devastation of World War II to become the world’s second largest economy after the US until China claimed that position in recent years.
Supported by the government and favoured by a culture of strong work ethics, Japan’s industry and businesses became masters of high technology with a steadily gained reputation for high quality and low production costs. But by the end of the 20th and into the 21st century economic growth had slowed significantly following the nation’s “asset price bubble” crisis. Since 2008, Japan’s economy has been through four recessions with various fiscal policy initiatives whose effectiveness leaves questions for the future.
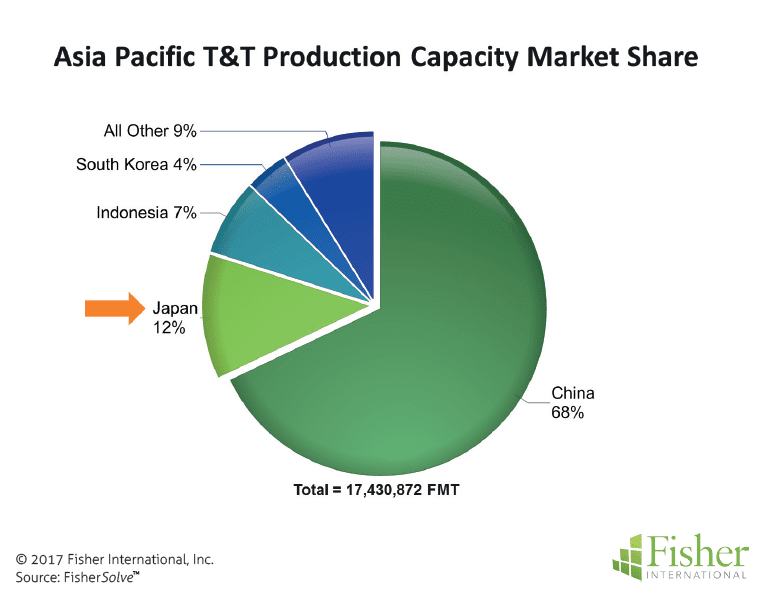
Geographically, Japan is part of the Asia Pacific Region where the Towel and Tissue (T&T) industry is dominated by China with 68% of the region’s capacity. Japan is the second largest producing country in the region with a 12% share (Figure 1). This huge share imbalance was not always the case.
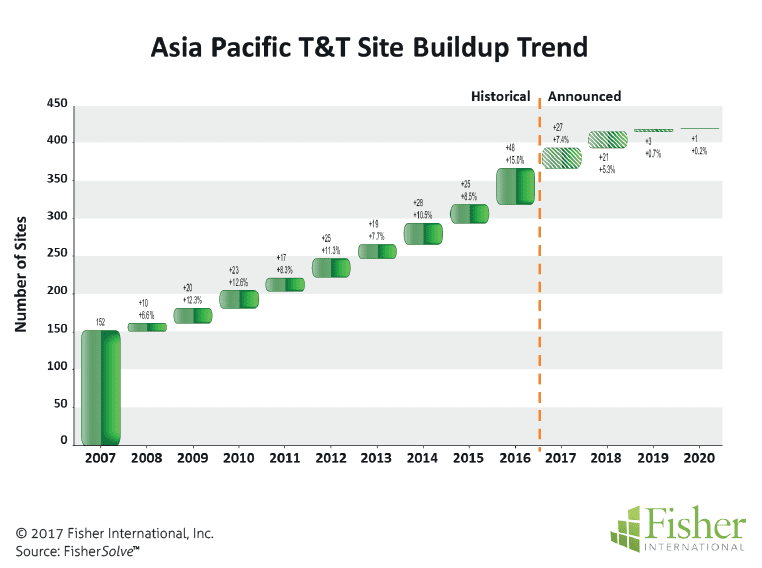
The region overall is going through very rapid expansion. In the past 10 years, Asia Pacific T&T has been growing at a cumulative average growth rate (CAGR) of 15%. Capacity today is nearly four times what it was in 2007. The number of operating sites more than doubled in that 10 year period and announcements suggest the trend will continue for the near future (Figure 2).
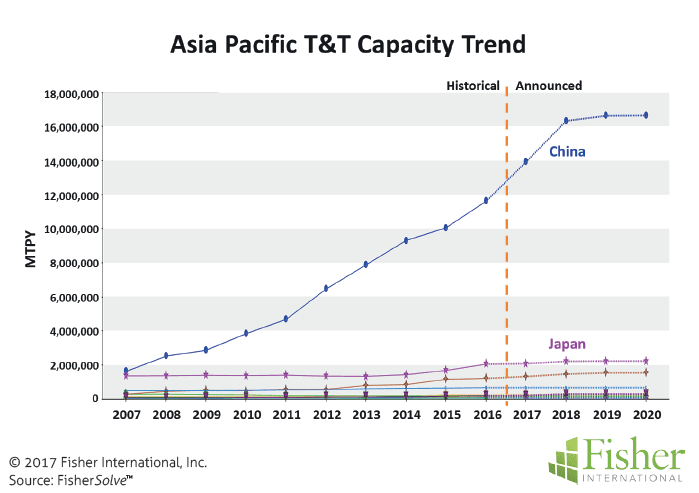
If we get granular and look inside the region, it is obvious that China is driving the regional growth (Figure 3). Back in 2007 China and Japan had nearly the same capacity. By the end of 2016 the share of capacity picture has changed dramatically.
The Japanese economic growth uptick in 2013 seems to have stimulated the T&T industry as well. Operating sites in Japan have moved off a flat growth pattern and increased dramatically to the point of nearly doubling the number of sites in the past three years (Figure 4). During this spike, capacity has grown at a CAGR of 15%+ from close to zero (0.42%) in the 2007 to 2013 period.
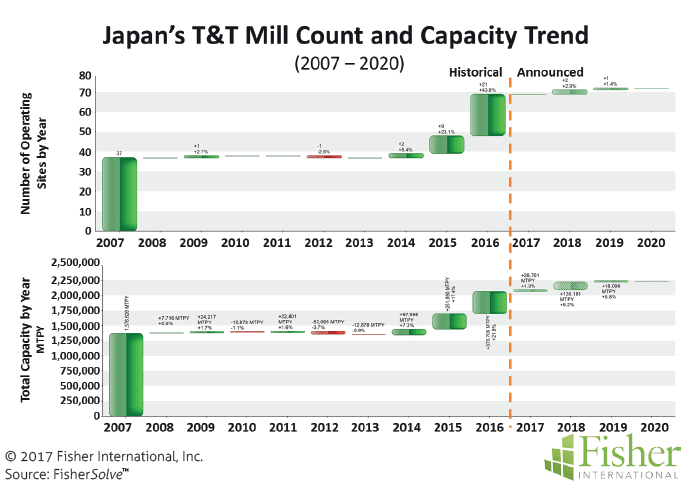
Some of the subsequent growth came from existing mills but the real capacity increase came from upstart T&T companies bringing new production online beginning in 2014 and increasing through 2016 (Figure 5).
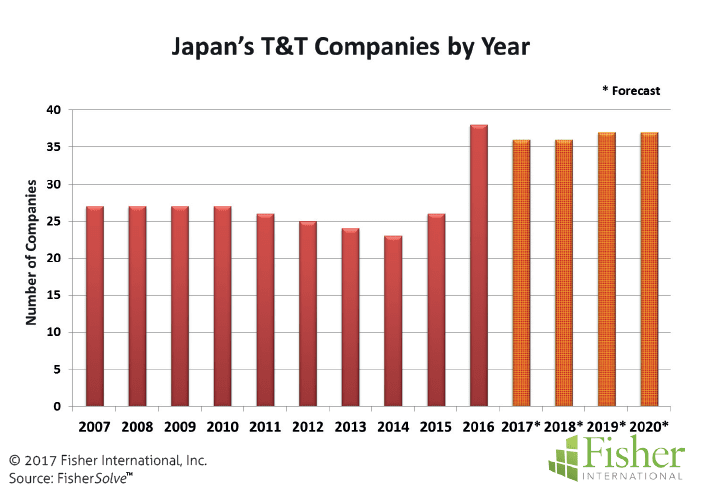
The new companies built new sites doubling the portfolio and it appears some additional sites are being planned for 2018-2020 (Figure 6). As you might expect, the paper machine count nearly doubled over the same period (Figure 7).
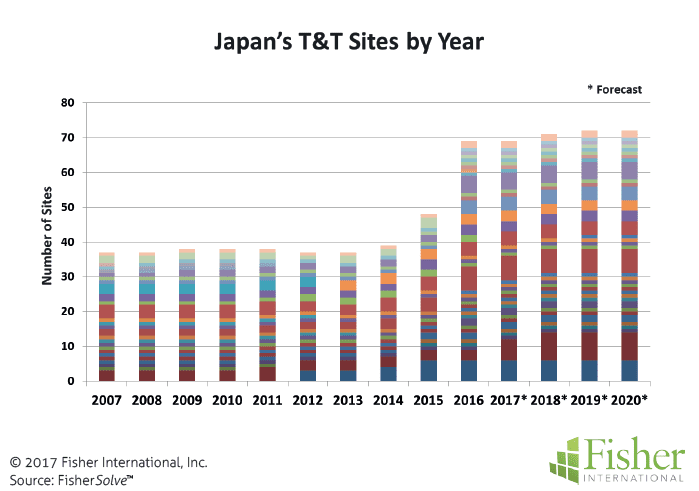
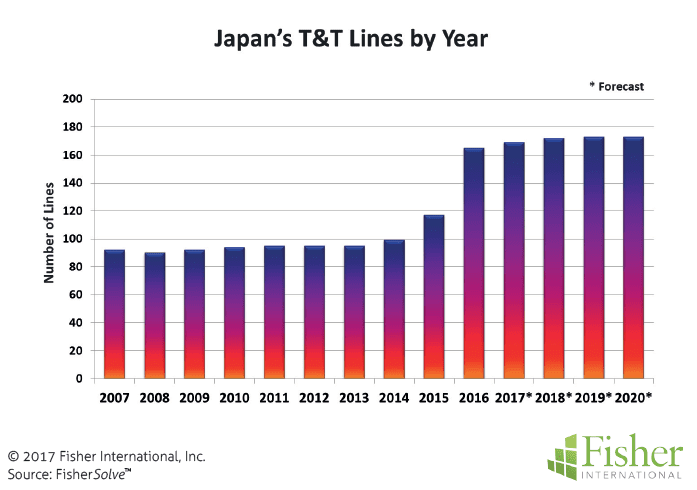
Figure 8 is a summary of the 160+ operating T&T paper machine assets in Japan. Paper machine installation dates range from 1950 vintage to recent installations in the past two years. The median installation year is 1986. Technical age is perhaps a better indicator of age (it includes age adjustments attributed to rebuilds over time as tracked in FisherSolve™). The oldest machine has a technical age of 62 years while the average technical age is 30 reflecting recent installs that are less than two years old. So it appears there is less activity in the form of major rebuilds than new installations.
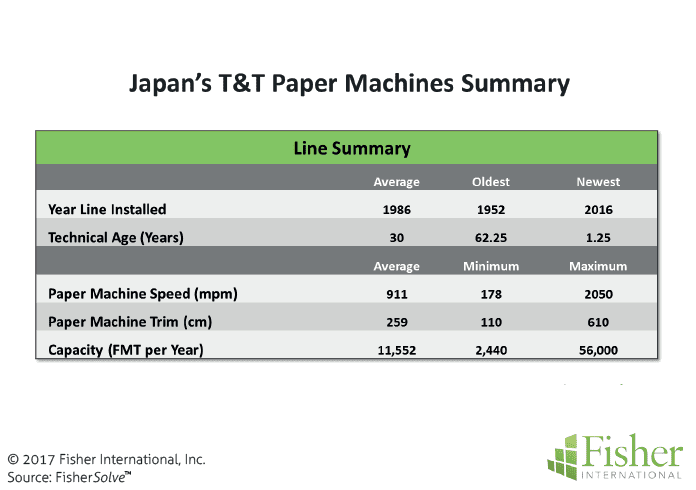
Japan’s T&T machine speeds are conservative compared to best practices standards but not atypical for Asia Pacific. The slowest machine is 178mpm which is not competitive beyond very specialized paper products. The maximum speed is 2,050mpm a very respectable modern-day machine speed. Average speed is 911mpm which means the portfolio is slow by today’s standards.
Trim widths are also narrow by today’s standards. The average is 2.6 metre with the narrowest machine being 1.1 metre (these are very narrow machines). The wider 6.1 metre machine would be more consistent with the bulk of machines being installed today. As a reflection of the size and speed of these machines, Japan on average has an asset portfolio that is very modest in capacity. This may be cost effective in small local markets where access or transportation costs are big factors. In larger markets with more capable competitors the modest machines could become non-competitive very quickly.
Cumulative Cost Curves are a good analysis method for thinking to the future and potentially increasing country to country competitiveness. The Asia Pacific Region is a fairly homogeneous market for T&T products. With respect to capacity in the region, China dominates with Japan and Indonesia representing much of the remaining production. Yet, China’s cost position does not match its capacity dominance. Indonesia is appreciably more cost competitive than China or Japan thanks to low energy costs. Japan is cost disadvantaged compared to the other two countries but not significantly higher than China (Figure 9). Japan’s significant disadvantage stems from energy costs (Figure 10). Being an energy poor country makes this drawback difficult to overcome. Japan does have an advantage over the other two countries where fibre cost is concerned. This is attributable to the use of recycled fibre which delivers a cost advantage over China and Indonesia who rely much more heavily on virgin purchased pulp (Figure 11).
In summary, Japan’s T&T business is enjoying the benefits of economic recovery policy in the country showing strong growth for the three years after stimulus measures were put in place. Growth is coming in the form of new entries in the market. The new entrants appear to be local-market driven consistent with the past. Investments and the overall asset portfolio are well suited for smaller, limited-size markets. This asset strategy may be difficult if the market becomes more international in the future since Japan’s cost position is not strong among likely regional competitors.


The source for market data and analysis in this article is FisherSolve™.
About Fisher International, Inc.
Fisher International supports the pulp and paper industry with business intelligence and strategy consulting. Fisher International’s rich databases, powerful analytics, and expert consultants are indispensable resources to the industry’s producers, suppliers, investors, and buyers worldwide. FisherSolve™ is the pulp and paper industry’s premier business intelligence resource. Complete and accurate, FisherSolve is unique in describing the assets and operations of every mill in the world (making 50 TPD or more), modeling the mass-energy balance of each, analysing their production costs, predicting their economic viability, and providing a wealth of information necessary for strategic planning and implementation. FisherSolve is a product of Fisher International, Inc.
For more information visit: www.fisheri. com or email [email protected]USA: +1-203-854-5390


