


By Bill Burns, senior consultant, Fisher International


Mexico has a free market economy in the trillion dollar class. Since the implementation of the North American Free Trade Agreement (NAFTA) in 1994, Mexico has increased its share of US imports from 7% to 12% and Canadian imports to 5.5%. Trade with the United States represents about 78% of Mexico’s exports. Mexico has free trade agreements with over 50 countries, resulting in more than 90% of trade under free trade agreements. Still, challenges remain. On the surface, unemployment at 5% is low. But underemployment is of concern, at as high as 25%. Pollution, particularly water pollution, and violence from feuding drug-trafficking organisations are also major obstacles to stability. Mexico’s GDP plunged 6.2% in the 2009 global downturn. GDP posted positive growth of 5.6% in 2010 with exports to the United States leading the way, but slowed to 3.9- 4% in 2012.
Towel and Tissue (T&T) appears to have benefited from the NAFTA agreement. Production capacity from 2002 to 2010 increased by about 30%. During the same time period, NAFTA in total had capacity growth of about 11% (Figure 1). Both NAFTA and Mexican production capacity has flattened out considerably since the global economic downturn in 2009.
‘Production capacity from 2002 to 2010 increased by about 30%. During the same time period NAFTA in total had capacity growth of about 11%’
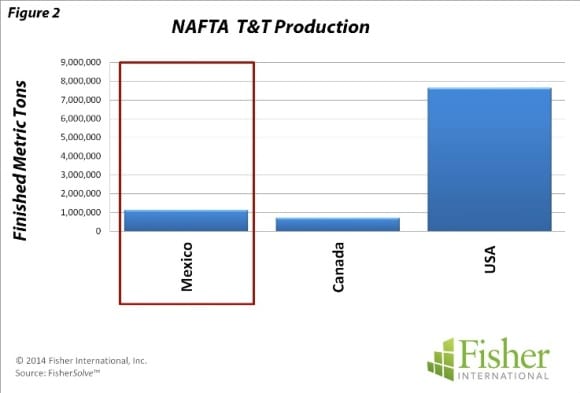
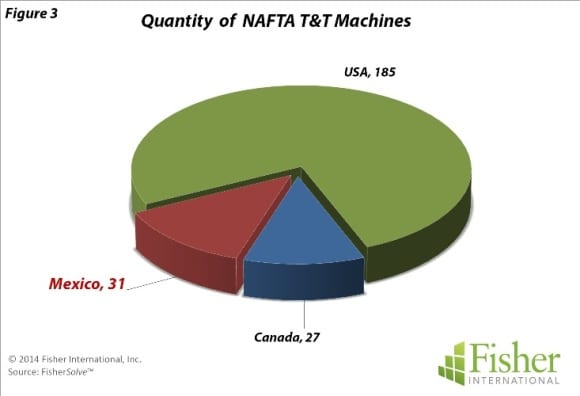
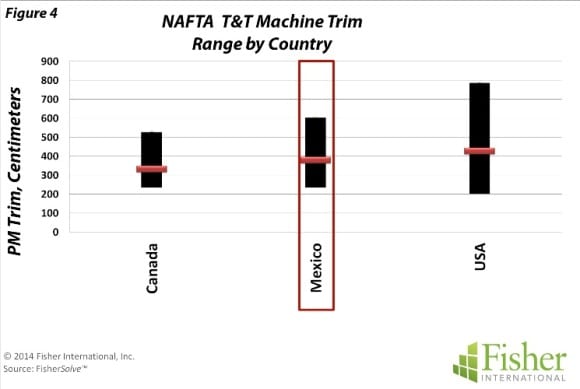
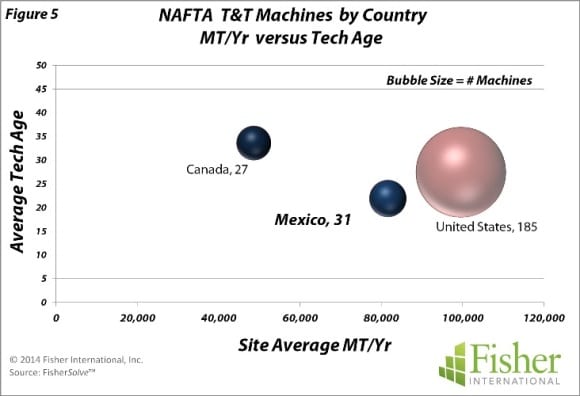
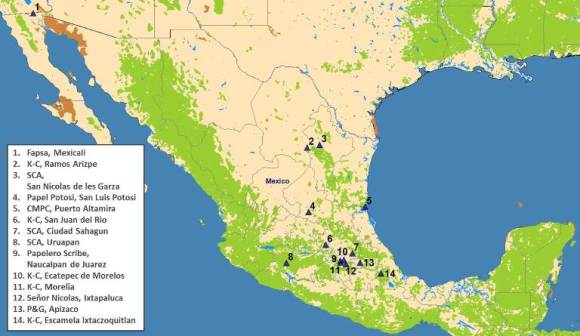
Mexican T&T mills are geographically dispersed in the non-mountainous and tropical regions (Map). With slightly higher production than Canada, Mexico ranks second in T&T production among NAFTA countries. The United States is the dominate partner in T&T production, outproducing Mexico 7 to 1 (Figure 2). The number of operating machines is also similar between Mexico and Canada, with the United States (US) operating 3 times as many as the other two countries combined (Figure 3). The average size of machines is more comparable among the three countries, but the US has more super-wide machines (Figure 4). Mill production in Mexico averages about 81,000 MT/Yr, ahead of Canada but behind the US. Plotting production against technical age shows Mexico has an advantage within NAFTA in Technical Age of T&T machines at about 22 years and a production advantage over Canada (Figure 5).
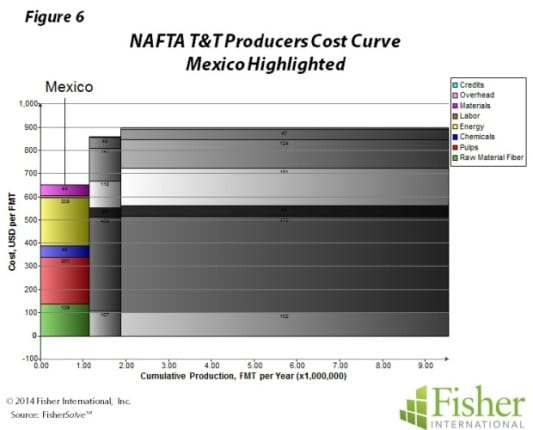
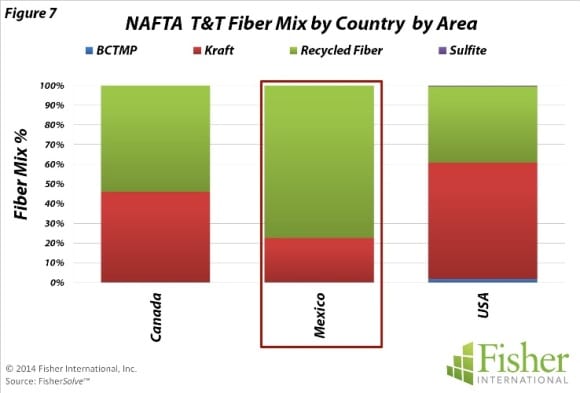
Mexico’s T&T cost position is strongest among the NAFTA partners: low pulp costs and labour rates provide a clear advantage to Mexico. Energy is Mexico’s only significant cost disadvantage before considering transportation and proximity to market (Figure 6). The fibre base within the NAFTA countries is primarily recycled and Kraft pulps. Mexico is biased toward secondary fibre with 77% of total fibre consumption, whereas secondary fibre represents 54% and 39% of Canadian and US consumption respectively (Figure 7).
‘Mexico’s T&T cost position is strongest among the NAFTA partners. Low pulp costs and labour rates provide a clear advantage to Mexico.’
[box type=”info”] Mexico in numbers
30% Increase in T&T production capacity from 2002 to 2010
78% Percentage of exports that represents trade with the USA
81,000 Average MT/Yr mill production[/box]
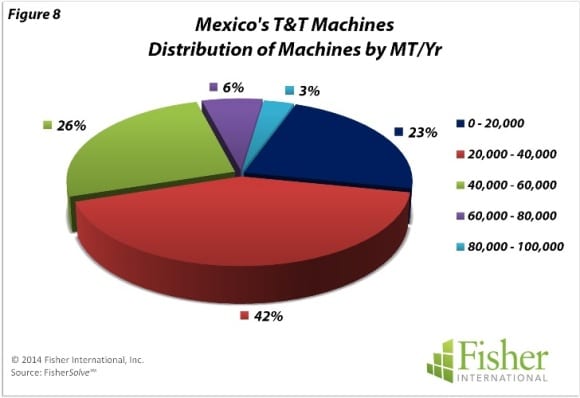
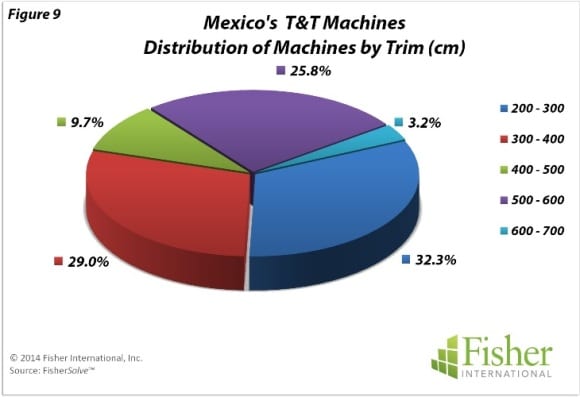
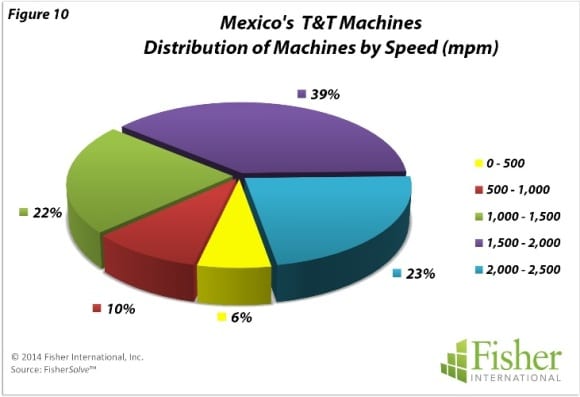
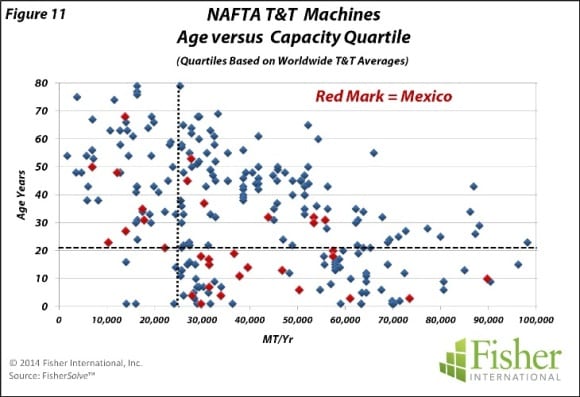
Production rates of Mexico’s T&T machines tend to be on the smaller side with about 65% in the 40,000 and under size range (Figure 8). Mexican machine trims are likewise on the narrow side: more than 60% are less than 4 metres and only 3% fall into the 6-7 metre class (Figure 9). Machine speeds are more respectable with more than 60% greater than 1,500mpm and 23% greater than 2,000mpm (Figure 10). The age of Mexican machines is widely distributed from new to 70 years old. Dispersion of Mexican machines falls in the same quadrants as the other NAFTA machines when plotted against the average of all T&T machines worldwide, with a bias above average production and below average age (Figure 11).
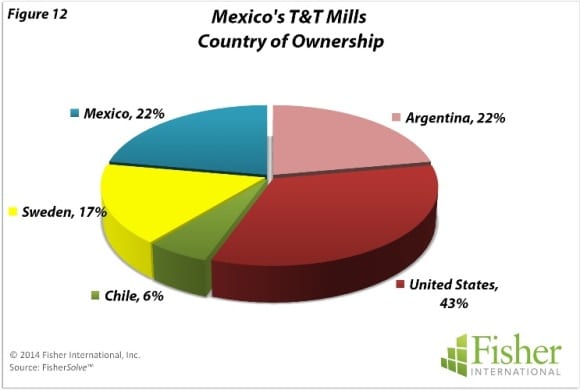
Mexico’s T&T business is international in trade and ownership, with 80% of the mills being foreign-owned. The US is the primary investor in Mexico with Argentina and Sweden also having a significant presence (Figure 12).
[box]The source for market data and analysis in this article is FisherSolve™. Data tables behind Figures 1 – 12 can be obtained from Fisher International. Email requests to [email protected].
About Fisher International, Inc.
Fisher International has supported the pulp and paper industry for over 25 years with business intelligence and management consulting. Fisher International’s powerful proprietary databases, analysis tools, and expert consultants are indispensable resources to the industry’s producers, suppliers, investors, and buyers worldwide.
FisherSolve™ is the pulp and paper industry’s premier database and analysis tool. Complete and accurate, FisherSolve is unique in describing the assets and operations of every mill in the world (making 50 TPD or more), modeling the mass-energy balance of each, analyzing their production costs, predicting their economic viability, and providing a wealth of information necessary for strategic planning and implementation. FisherSolve is a product of Fisher International, Inc.
For more information visit: www.fisheri.com or email [email protected] USA: +1-203-854-5390 [/box]


