


By Kemira’s Clay Campbell, Lucyna Pawlowska, Xiaosong Huang

There are different roads one can take to achieve tissue softness. The key is to be able to determine how to get there and when you are at your target destination. An easy and reliable measurement of sheet properties that determine softness will help to choose the most effective path and set a measurable sheet quality target.
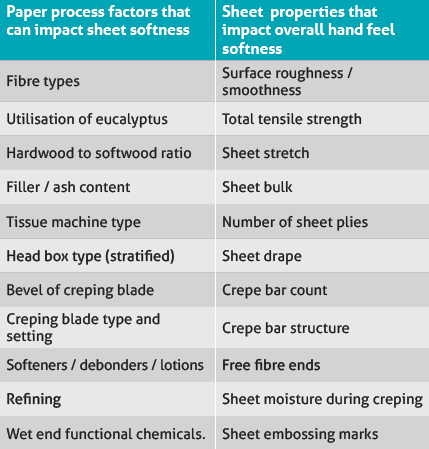
Paper manufacturers can utilise a variety of process tools to improve overall surface softness, formation and appearance. The most important factors are the fibre type and the hardwood to softwood ratios, followed by machine type and creping process configurations. Each process change impacts the sheet structure in positive or negative ways. The key to improving and maintaining final sheet softness is to measure how each process factor change impacts the sheet structure and then how each change in sheet structure impacts the softness.
Conventional crepe bar count methods utilising a camera and microscope with manual measurements tend to be cumbersome and very limited by looking only at one of many important sheet structure variables. Kemira has developed KemView™, a unique sheet structure analyser that provides quick, but very detailed and objective analysis of the sheet structure.
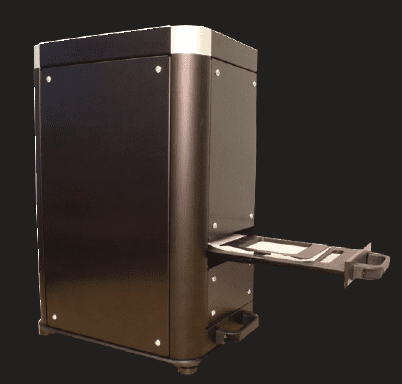
KemView™ sheet structure analyser (SSA) description / features
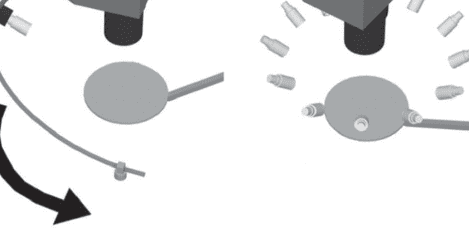
Kemira KemView™ SSA is an easy to use, fast response, sheet structure analyser that provides a diverse array of sheet measurements that can be effectively used as a laboratory and field support tool assisting in the diagnostics of paper sheets. It consists of a digital optical detector positioned above two sample trays. The upper tray used for free fibre ends (FFE) measurements and the lower tray is used for crepe structure analysis. LED bulbs illuminate the sheet sample in the upper and lower trays. The sample is illuminated from eight directions: one light at a time for FFE planar count and four light positions for crepe bar structure measurements.
Its features are beneficial for new grade development, external product benchmarking, comparison of the same product manufactured on different machines, and troubleshooting sheet quality issues. It provides quick feedback allowing for optimisation of creping, softening and strength programmes.
A variety of sheet surface properties can be measured using it and Emtec’s Tissue Softness Analyser (TSA). Combined results from these two measurements provide a comprehensive insight into the sheet structure and softness, and allow for comparative analysis of various tissue products.
drawn to same image on the right
KemView is a novel image-based measurement tool that provides in-depth 3D analysis of the sheet with the ability to easily measure the following parameters:
• Crepe bar count (#/ inch)
• Crepe bar width, length and height
• Crepe bar uniformity and distribution
• Embossing pattern
• Sheet roughness and intensity (crepe visibility)
• Pinholes
• Number of free fibre ends (FFE)
Typically, a sheet structure that has a high crepe bar count and low crepe bars intensity (visibility) provide softer tissue. The higher free fibre ends count, the softer or more velvety hand feel surface.
Free fibre ends extending from the surface of the sheet significantly affect tissue surface softness. Many commercial softness analysers tend not to be sensitive enough to detect the beneficial impact of FFE. The fibre source has the most influential impact on the development and formation of FFE. Eucalyptus hardwood fibres are commonly utilised in premium bath and facial tissue grades as it contributes to the highest softness and development of free fibre ends, which results in providing the sheet with a velvety hand feel surface characteristic. On a per gram pulp basis, eucalyptus offers 20 million FFE, whereas Southern and Northern Kraft pulp provides three and 10 million FFE, respectively.
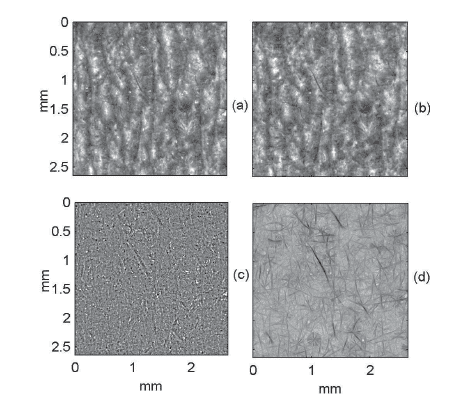
KemView™ SSA free fibre end shadow imaging detection method and measurement system is patent pending technology, utilising photometric stereo which counts the free fibre ends developed. The free fibre ends are detected from the reflectance images based on the shadows of free fibre ends. The shadows are detected by constructing tissue surface with photometric stereo and finally subtracting it from the creping pattern or original reflectance image from the images of tissue paper with photometric stereo method. The shadows were made visible by removing the creping pattern from the images of tissue paper with photometric stereo method.
In addition, the KemView™ SSA FFE detection incorporates a folded tissue paper method.
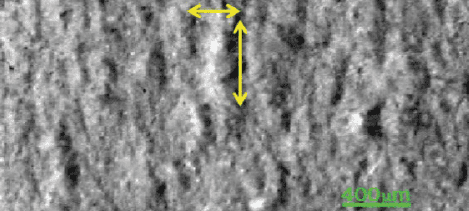
The surface boundary was estimated by computing the difference of the pixel vector in the y direction for each x location. The maximum difference in y-direction was obtained and the mean value from the neighboring surface boundary points in the x-direction was computed.
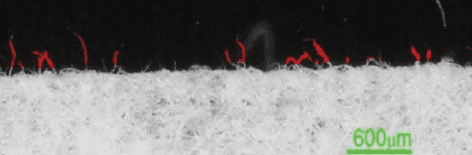
Fibres whose location was more than 50 μm above the estimated surface boundary were considered to be free fibre ends (see Fig. 4). FFE are marked and then counted per cm². It is important to properly manage the development of FFE on the sheet surface by maximising the FFE count and minimising potential sheet lint and dusting potential.
Sheet pinholes can be frequent quality concerns in tissue grades. Typical source of pinholes are biological, organic and inorganic contaminates that deposit on machine fabrics, rolls and sheet surface and cause sheet picking. Another source of pinholes is sheet picking at the Yankee Dryer / doctor blade interface. The Kemview™ SSA pinhole detection method is based on the linearly polarised light transmitted through paper and the camera with a rotating polariser. The pinholes are detected from the difference of the two images which increases the contrast making the pinholes more visible. The difference image was threshold to be able to count the amount and the area of pinholes.
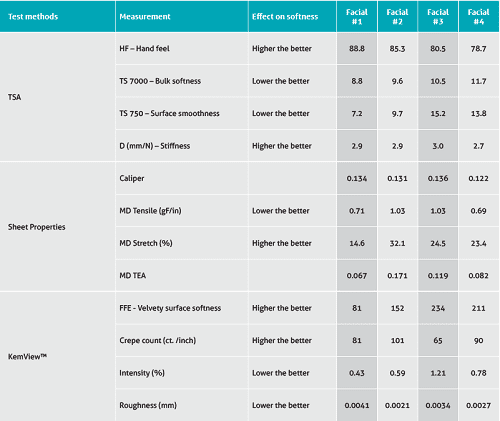
CASE STUDY #1: Comparison of retail 2ply consumer facial tissue from four different manufacturers
Four North American consumer facial tissue products were tested for sheet strength, crepe structure, FFE’s & softness utilising a tensile tester, KemView™ SSA, and Emtec TSA. Facial tissue #1 followed by facial #2 had the highest TSA hand feel (88.8 and 85.3, respectively), while facial #4 had the lowest hand feel (78.7). There was not a major spread between the four consumer facial products.
Within each facial tissue sheet there are parameters that are better and worse than others. By addressing the areas of weakness, overall softness improvement for each product can be achieved.
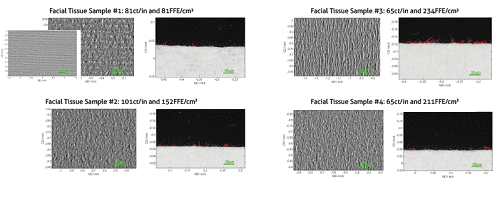
Facial tissue #1 appears to be made on a TAD structured sheet machine, as indicated by sheet structure design, while the three other facial samples were made using a conventional dry crepe process. FFE count of facial tissue #1 may be low as a result of the structured sheet design.
Facial tissue #2 has a very high crepe bar count (101ct. in) and high sheet stretch.
Facial tissue #3 has poor surface smoothness, high crepe bars intensity and a very low crepe bar count. An increase in the crepe bar count and decrease in crepe bars intensity could increase TSA hand feel from 80.5 into the mid 80’s.
Facial #4 had a very high FFE count and a relatively high crepe bar count, which contributes to tissue softness. However, both bulk softness and surface smoothness measured by TSA are not that great. In this case, selecting fibre of higher quality could improve softness.
CASE STUDY #2: Comparison of standard and premium facial tissue produced by one tissue manufacturer
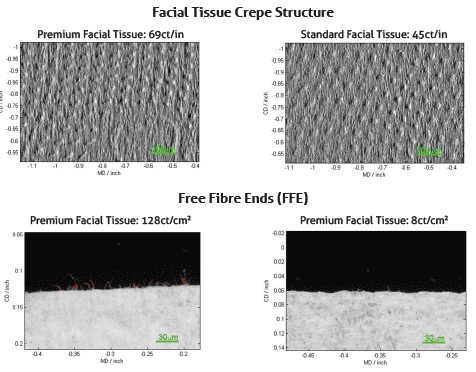
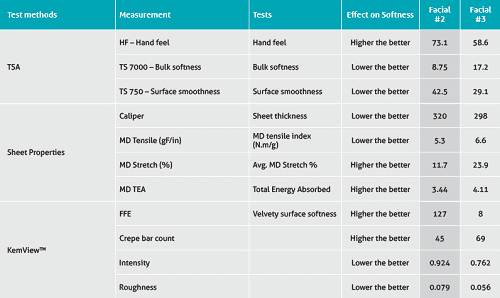
Two Asian facial tissue samples (premium vs standard) were analysed using Emtec Softness Analyser and KemView™ Sheet Structure Analyser. Premium facial has higher overall TSA hand feel softness (73.1) than standard facial (58.6), but both overall are not very soft. This may be due to a large extent to a low crepe bar count and poor crepe structure. Premium facial has a fairly high FFE count (128 ct./cm²), while the FFE count in the standard is very low (8ct./cm²). It appears that the standard facial is not utilising high quality fibres, as indicated by an extremely low FFE count.
Standard facial has more and finer crepe bars (69ct./in) than premium facial (45ct.in) and lower crepe bars intensity (visibility). The surface roughness of premium tissue is higher than surface roughness of standard tissue (0.079 vs. 0.056), which indicates a deeper embossing pattern of premium tissue.
Conclusions
There are many process factors effecting sheet softness. Kemira’s KemView™ SSA unique multi-functional portable measurement tool provides quantitative insight into the sheet structure, creping efficiency, free fibre ends, pinholes and overall sheet surface parameters that correlate well to sheet softness. KemView™ SSA is an effective field support tool allowing quick testing feedback, troubleshooting sheet quality and production issues, and optimisation of the creping process.
This article was written for Tissue World magazine by Kemira’s Clay Campbell, Lucyna Pawlowska, Xiaosong Huang.


