By Buckman’s John Stitt and Holly Richardson
Softness: we know it when we feel it. We try to model it with complex equations. Now we even have a pretty good test instrument available that hears it. But what are the physical characteristics that cause the differences in tissue softness? Here, Buckman’s John Stitt and Holly Richardson discuss a new approach to understanding and better controlling processes that determine tissue softness.
This project was conceived to determine:
- methods of microphotography that can be used to understand and communicate properties of sheet structure and fibre bonding that result in variations in sheet softness
- determine if observable variations could be used to define small differences in softness such as those realised in creping improvement evaluations
- establish procedures for taking/providing relevant photographs for use in process improvement proposals and trial reports.
First examined were paired tissue samples with large softness differences. These samples were manufactured using the same furnish and from the same run on the same machine. In the first phase of the study it was confirmed which visual differences could be seen under magnification and what methods to use to best see these differences. A number of examination methods were evaluated and four methods for examination of each pair of samples were chosen that together best identified softness differences.
The next phase was to compare paired samples with small differences in softness and determine if small softness differences could be seen and what physical characteristics resulted in the perceived small softness differences. Finally a confirmation run was made to verify the findings. This paper gives the reader a better understanding of what makes a sheet soft. This knowledge of physical properties that result in softness provides a foundation for process modifications to enhance tissue softness.
“Good Tissue” is a perception of the user. It varies from person to person, and market to market. It is not always rational and can vary largely with different cultures. Softness is the most elusive and often seemingly fickle of tissue properties because it is based on consumer perception, not quantified parameters. A quest of the tissue marketers and manufacturers is to translate the respective perceptions of their markets into measurable and controllable properties. There are certain fundamental properties that influence the perception of softness and it is possible to identify and then control them for the various concepts of tissue qualities.
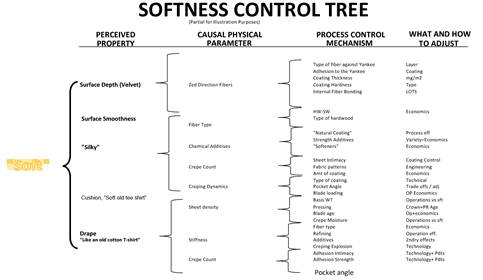
For those who wish to pursue a complete matrix for maximising their concept of softness, there is a tool called Quality Function Deployment (QFD).
There is no measure nor any unit of “softness”. Most measures are an attempt to correlate measurable properties with perceived levels of softness. For example, the latest, perhaps most widely accepted, test instrument, TSA, correlates with sounds when rubbing the sheet in a controlled manner. Creping is elusive because so many factors influence softness and they are confounded with each other. Using fibre morphology knowledge, creping theory, experience, and microphotography skills this study attempts to better understand the basic sheet structures that result in perceptions of good softness.
Identifiable reasons why a sheet is soft include:
- Crepe explosion – (bulk to basis weight ratio, MD stretch to crepe ratio or, CD stretch, fibre bonding, quantifiable)
- Crepe count (fineness of macro crepe), the nature of the surface, and the balance of macro and microcrepe
- Stiffness (fibre type, intra fibre bonding)
- Refining (intra fibre bonding, strength/fibrillation, stiffness)
- Polymer filling and bonding (stiffness, low bulk:bw)
- Fines and ash (low sheet to basis weight, stiffness)
- Surface feel (zed direction fibre on surface, fibre depth, sheet explosion)
- Compaction (forming, pressing, wet vacuum, drying dynamics)
- Since there is no one property that directly results in “softness,” it is logical that a specific combination of properties must result in one of the types of perceived softness.
Softness directly influencing factor categories:
- Sheet density – drape, cushion, stiffness
- Strength – stiffness, drape, not like a soft old tee shirt
- Surface depth – fibre attachment and explosion (bulky feel)
- Surface properties – creping geometry and dynamics
PHASE 1 – proving methodology
In the first phase of the study it was confirmed which microscopy and photography methods to use to see differences. A number of examination methods were evaluated, and four techniques for examination of samples were chosen that together best identified softness differences.
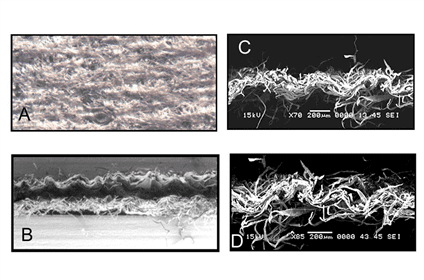
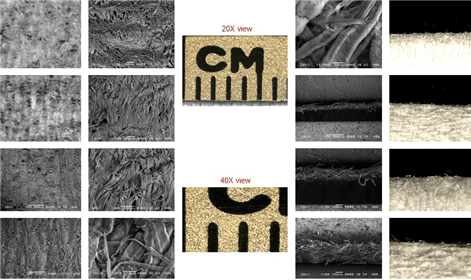
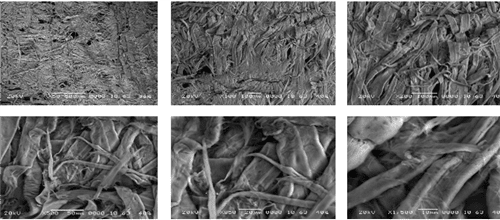
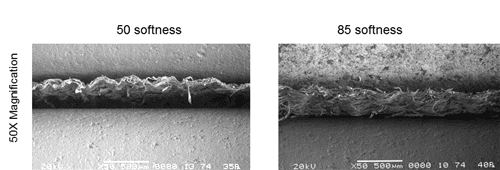
The four techniques chosen were 1) a low magnification surface view where we examined crepe count and nature of the crepe. 2) Ultra high magnification of the surface, where we are looking at microfibril bonding, fibre morphology and fiber/layer structure. 3) Folded edge view where the primary focus was on zed direction fibres emerging from the surface which give a deep velvet-like feel. 4) Cross-sectional view where we can see crepe structure, debonding (bulk vs. basis weight – cm3/gm.). Because of the difficulty of the cross-sectional sample preparation, this view was used less than the other three.
Folded edges were examined with a stereoscope and optical microscope at 20X to 100X. Lighting techniques used were oblique, angular, and back lighting. A photographic summary of this phase is shown in Figures 3 and 4.
Phase two
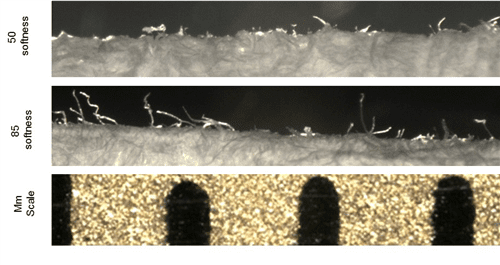
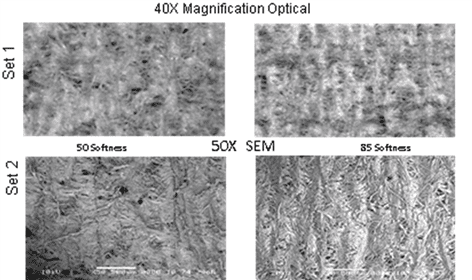
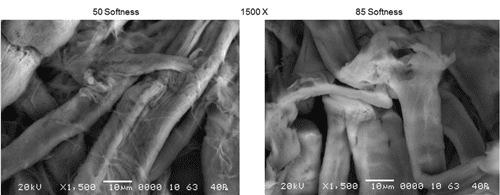
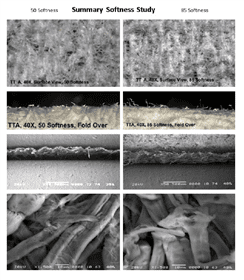
Paired sets of closely matched reel samples of tissue with a large softness difference were looked at and panel evaluated at 50 and 85 softness. The aim was to see if there were differences in similar sheets with such a large difference.The sheet surfaces were looked at using an optical microscope and a Scanning Electron Microscope (SEM) with 20X to 1500X magnification. Cross-sections of sheet structures at 20X to 200X with examined with the optical microscope and SEM.
Figure 5E is a summary of the Phase 2 study. The question was answered: large differences in softness can be seen and even the cause of the difference can be defined using microphotographs.

Phase three
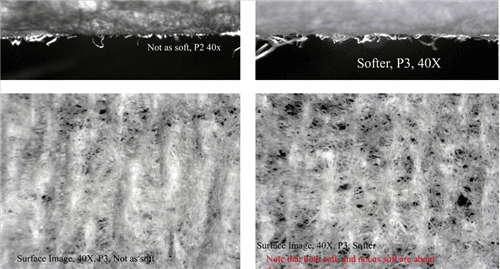
The purpose was to evaluate samples with small differences in softness (five to 10 points on the Scott/TSA 100 point scale) using three, and sometimes four methodologies (2 types of surface views, one optical folded sheet, and sometimes one cross-sectional view,) as per the procedures of Phase two. The results of this study are shown as follows.
Small Difference Evaluation two
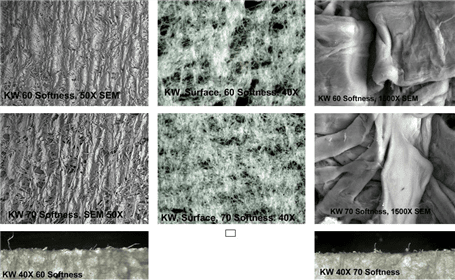
In reference to Figure 7, with a 10 point panel softness difference, physical property differences are visible. Neither the folded edge views nor the 1500X SEM microphotographs showed any significant differences. The SEM and 40X optical surface microphotographs do show a difference. The 60 softness sheet photographs show a clumpier appearance with thick then almost open areas. The SEM 50X surface scans show a very significant difference.
While the 70 softness crepe is fine and with uniform microcrepe, the 60 softness sample shows a pattern of coarse crepe followed by a few peaks of fine microcrepe then another large coarse crepe.
This is typical of a sheet creped with poor attachment to the Yankee surface and a relatively closed pocket. What is needed based on this comparison is better control of the sheet attachment.
Phase four
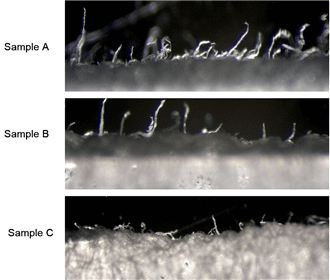
To confirm the methods, almost identical toilet tissue sheets were made on a pilot tissue machine. Three tissue sample sets made with different wetend chemistry and creping operations for relative softness were examined. The samples, A, B, and C, the softness of the sets were ranked by only photographic evaluation by creping professionals (Figures 8A and 8B). The duplicate samples were given to a softness panel of five non-tissue industry people, mostly women, and they were asked to rank the samples “Softest”, “Middle Softness”, or “Least Soft”. The panel members were not shown the pictures nor were the creping professional rankings from the photograph disclosed. The goal was to have the photographic evaluations correlate well with the panel results.
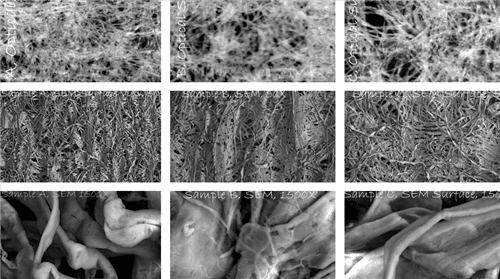
The results from the panel test were:
- The five people were asked to rank the softness and state why; all five people voted the same.
- A – Softest – because “smoother, cottony, velvety”
- C – Middle – “stiff but not as stiff as B, felt more like 100 thread count sheet, softer than B”
- B – Least soft – “because of texture, stiff, rough, peaks and valley feel.”
- Their ranking is 100% correlated with the ranking made by creping experts looking at the pictures.
‘Their ranking is 100% correlated with the ranking made by creping experts looking at the pictures.’
Conclusions
When customers, a panel, or TSA detect a softness difference of 10 points or even less, it is possible to visually find the differences in the sheet that result in the difference in perceived softness.
No one type of microphotograph will always explain a difference in softness; but, with a number of photographs, a person or persons familiar with tissue processes, especially creping, can determine what are the possible causes for the difference and what are the best actions to take to improve the softness. With the analysis of tissue process experts, significant softness causes can be identified, and operations management can implement specific process improvement plans based on microphotography analysis. Microphotography of tissue sheets can be a valuable tool in determining a path forward toward improving softness or as a diagnostic tool for softness issues.
This article was written by John Stitt, Buckman’s global specialist for tissue processes and creping, and Holly Richardson, Buckman’s master industry chemist, technical services.


