


Impressive long-term capacity growth of 11.8% is stalling, but a modest rise in the birth rate of only 0.72% shows that usage is still moving forward. Report by Bruce Janda, Senior Consultant, ResourceWise.

In April 2023, India surpassed China as the world’s most populous nation. Over the past two and a half decades, China has emerged as the global leader in tissue production, holding the top spot in purchasing tissue equipment and supplies. However, tissue manufacturers and their supporting industries are closely monitoring India’s tissue industry’s rapid development, eager to establish another Asian hub for tissue production.
India’s tissue industry’s growth potential has long been a subject of interest. Despite its vast population, the country has consistently experienced anomalously low tissue demand compared to other developing countries. Therefore, this historically low tissue consumption per capita has constrained the industry’s growth prospects. Understanding the reasons behind this low consumption and its potential for growth is crucial for the global tissue industry.
Given the anticipated growth in tissue consumption and, consequently, the demand for tissue fibres, it is important to acknowledge that large populations in Southern Asia and regions of Africa remain underserved or unserved. The question is how swiftly these latent demands will be realised. In a speech delivered a decade ago, Narendra Modi, then the newly elected Prime Minister of India, famously stated: “Building toilets is a priority over temples.” India serves as a prime example of the challenges and opportunities presented by expanding global tissue product penetration. Toilets and indoor plumbing are essential catalysts for the adoption of toilet paper.
Generally, tissue consumption per capita reflects economic and cultural influences related to hygiene and sanitation standards. The United States stands out globally due to its advanced tissue market and high consumer demand, averaging around 25kg annually. This consumption is primarily for personal care and hygiene products. For perspective, the global average tissue consumption is a mere 5kg per person.
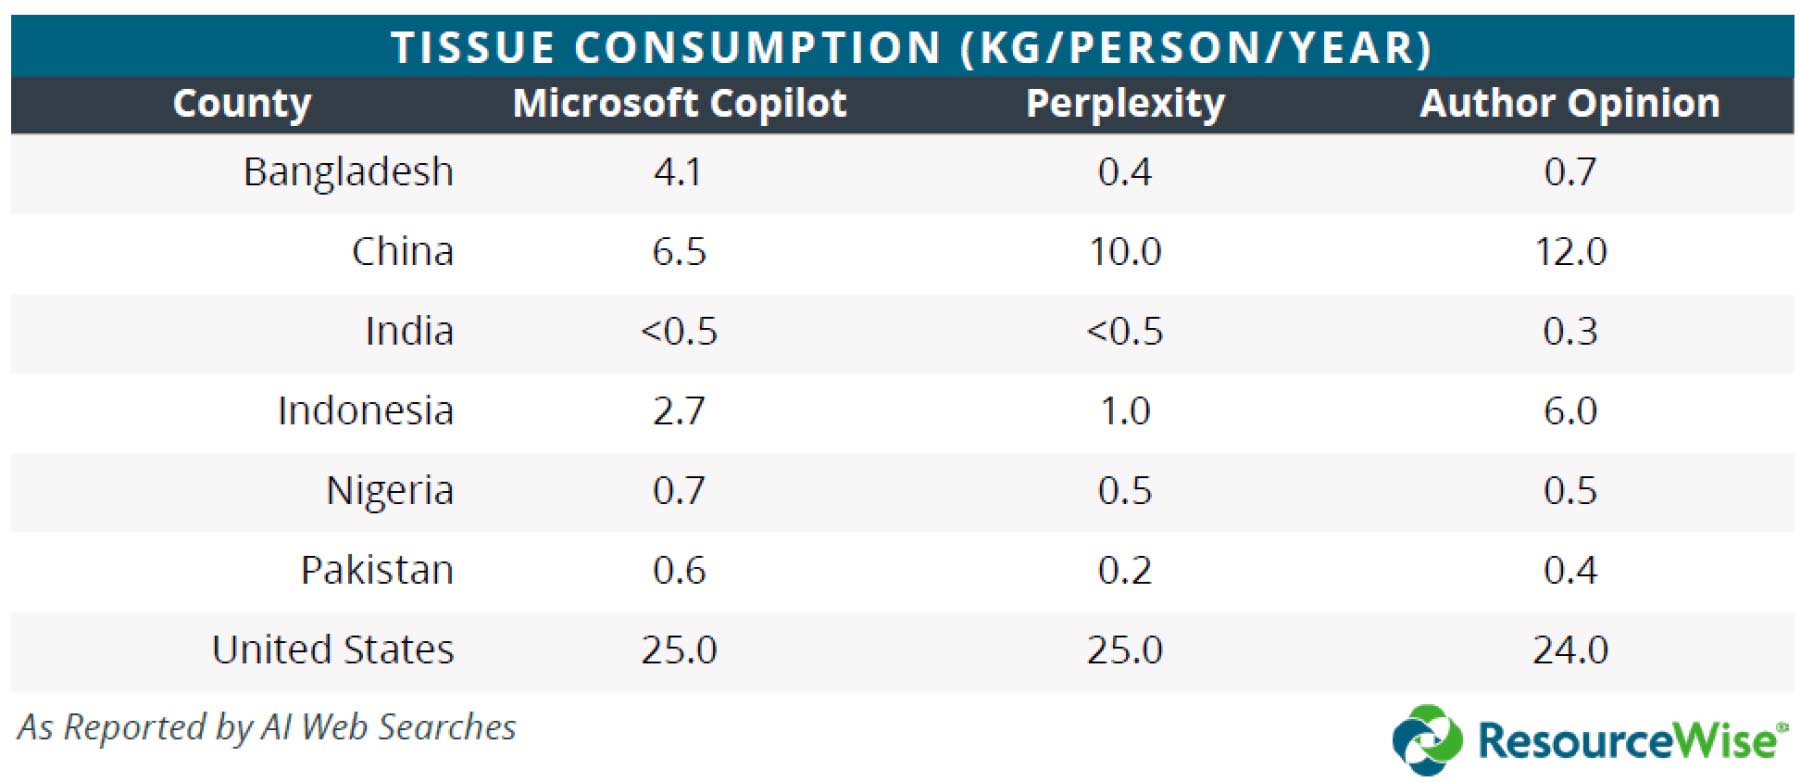
In stark contrast, many emerging markets such as India, Pakistan, and Bangladesh, have significantly lower usage at below 0.5kg per person. This disparity stems from varying habits and limited access to tissue products in these regions. While China’s tissue consumption is lower compared to developed countries, it has experienced a rise due to economic growth and shifting consumer preferences, which are expected to further increase tissue consumption in the coming years.
To compare industry and consumer differences, a set of developed and developing countries was selected for this report. The United States was chosen as the world leader in tissue consumption per capita. This is attributed to cultural factors, economic growth, and the increasing penetration of products like kitchen roll towels used at home for cleaning and cooking instead of reusable fabrics. Additionally, the United States holds the world’s largest share of commercial tissue products sold to businesses for use away from home.
Bangladesh and Pakistan share similar factors with India, including a predominantly Muslim population, while China serves as a direct comparison. Indonesia represents another Asian country that has rapidly developed its paper industry over the past quarter century and has become a net tissue exporter. Nigeria, an African nation that also uses English as a second language like India, is struggling to develop its hygiene industries.


To gain a global perspective, a web search was conducted using two AI platforms to retrieve tissue consumption per person data. Adjusted values are presented in the third column based on personal experience and direct calculations. These results are summarised in Table 1.
These results generated by large language model artificial intelligence demonstrate the vast range of variations in expert opinions that can be anticipated. For instance, Bangladesh’s 4.1 Kg/per capita consumption seems quite high. In contrast, Microsoft’s CoPilot does not provide as much documentation regarding the sources of its data as Perplexity does. Perplexity first acknowledges that a significant amount of specific data is unavailable, but then lists the references used to infer the data. Notably, several of these web references include Tissue World Magazine.
Specific Perplexity references generated:
- TWM GLOBAL AVERAGE PER CAPITA TISSUE CONSUMPTION STANDS AT ABOVE 5KG – BUT 10KG IS POSSIBLE
- TWM China’s state of the nation tissue report: Overcapacity a serious concern as market competition and innovation increase, with ‘Dual Carbon’ goals extended
- TWM OPERATIONS REPORT: A Southeast Asian “premier titan” embarks on visionary expansion
- TWM INDONESIA COUNTRY REPORT: Poised to get back on its fast-growth pathway
- The Pulp and Paper Times Outlook of Paper & Tissue Industry in Bangladesh…
- Polarismarketresearch Industry Analysis Tissue Paper Market…
- FastMarkets 2022 tissue demand was revived in most regions…
- Indexbox Nigeria Tissue Paper Market 2024
- Indexbox Pakistan Tissue Paper Market 2024
- Yuanhuapaper Bangladesh-tissue-market
- Mordor Intelligence Global tissue paper market industry
The straightforward approach to calculating annual tissue consumption per capita involves noting the current installed capacity in each country and adjusting it based on the net effect of trade to determine domestic supply. This supply is then divided by the country’s population.
Figure 1 illustrates a trend line for each country in the comparison set using FisherSolve data. While this approach is suitable for accountants and engineering mindsets, it has the potential to be misleading. UN Comtrade data may not always be accurately reported and could be out of sync with the current time. Tissue industry capacity data is a forecast for the current quarter and may not reflect downtime that occurred. Additionally, new capacity and debottlenecking may be counted early or late. Furthermore, tissue in storage or transit volumes are assumed to be steady-state, disregarding any changes in customer or consumer storage. One way to mitigate timing or measurement errors is to analyse the data in a trend, as depicted in the chart.
India, Pakistan, Bangladesh, and Nigeria all have significantly lower per capita fibre consumption rates, which makes the scale misleading. Surprisingly, the United States rate has been declining since the pandemic. This is likely due to reduced hoarding (in homes and small businesses) and the continued rise in advanced technology products that require less fibre per person. On the other hand, China’s rate appears excessively high. This is attributed to China’s tissue industry issues, including overcapacity and other economic factors affecting domestic consumer demand. These factors were considered when developing the figures presented in the opinion column of Table 1. The bottom line is that Indian tissue consumption could increase tenfold and still be below the world average. How quickly this happens depends on how quickly India solves some of the issues holding back the development of toilet access, consumer product distribution, consumer tissue benefit awareness, tissue expectations in the hospitality and industrial sectors, and more.
India does indeed have tissue mills, as the current locations are indicated on the map in Figure 2. Approximately 28 sites are currently producing tissue in India, and there are around 35 existing tissue machines. India’s total tissue capacity has experienced a remarkable growth rate of 11.8% (compound annual growth rate) from 2007 to 2024. However, the announced capacity from 2025 to 2028 suggests a growth rate of only 6.7%, indicating that the growth rate is not accelerating. Nevertheless, India’s population growth rate in 2024 is estimated to be a modest 0.72% indicating that issue consumption is slowly increasing.
India’s tissue industry, though small compared to its population, has a rich history with papermaking technology. Figure 3 presents a breakdown of paper grades produced, with containerboard and cartonboard being the most prominent. The remaining grades each exceed tissue capacity.
Most Indian paper production, across all grades, relies on recovered fibre from recycled papers. The FSC has recognised and acknowledged India’s recycling of waste raw materials. To obtain FSC recycling certification, an organisation must demonstrate that over 70% of its waste raw materials are recycled. Notably, the Indian paper industry exclusively sources raw materials from non-forest trees, preserving natural forests. Approximately 1.8 lakh hectares of plantations in India are certified by the FSC. Notably, most tissue production is also based on recovered fibre.
India’s population and GDP/Capita (PPP) is shown in Figure 4. India’s rapid population growth is over, but its demographics support growth better than that of the ageing United States or China.
Real GDP has been growing at 7-10% in the past three years. This also supports increased tissue consumption.
India’s experience with inflation was typical during the recent pandemic and European war years. However, an earlier bout of high inflation during the Great Recession appears to have been corrected. This represents another positive tissue consumption growth factor.
The country’s unemployment statistics are notably absent from the usual country report chart. The World Factbook provides India’s unemployment rate, which has decreased from 6.38% in 2022 to 4.17%.
India imports more tissue than it exports. Figure 6 shows that tissue imports are increasing with expected pandemic upsets. Tissue imports have rotated through a variety of regions. The latest and most recent imports are from Indonesia, South Korea, and Australia.
The corresponding export trend is shown in Figure 7. The scale on the exports chart is somewhat smaller as imports exceed exports. Qatar has purchased most recent exports along with Sri Lanka.
Figure 8 plots the relative tissue capacity of each country in the comparison set. China has a vast tissue capacity, followed by the United States. India shows a larger tissue capacity than Pakistan, Bangladesh, and Nigeria. Again, tissue consumption rates are very different. Interestingly, China has developed a significant share of commercial tissue business outside the home, like the United States. Indonesia is starting to create a commercial tissue business while India’s is a small one, just visible on the chart.
Figure 9 provides the same chart type but shows each country’s typical fibre type used for tissue production. Indian tissue uses deinked, non-deinked, hardwood, and softwood. China is about 15% non-wood fibre. The United States, on the other hand, uses a huge proportion and absolute amount of deinked fibre in tissue production. India’s tissue production is broken out by tissue product format in Figure 10. Consumer bath is the largest category. Commercial towels, being the second largest category, are worthy of further study as this is unexpected.
Figure 11 illustrates this comparison, plotting the average technical age of each country’s machines on the X-axis against the average tissue machine line speed on the Y-axis. The size of each bubble represents the total capacity of each producing country. India’s tissue fleet is the 2nd newest, just ahead of Indonesia. However, India’s tissue machines are slower than those of Bangladesh or Nigeria. This indicates that the quality of India’s relatively new machines may not be very high. Pakistan is somewhat of an anomaly due to the world-class speeds achieved by its tissue machines.
Figure 12 compares the same countries alongside India, focusing on the average cash cost of producing a ton of tissue. The height of each bar indicates the production cash cost for each country, while the width represents their relative tissue capacity. Additionally, the coloured segments within each bar illustrate the costs involved, including raw fibre materials, market pulp, chemicals, energy, labour, materials, overhead, and any credits.
India has the third lowest production costs among the group. A comparison of the color-coded bar stacks reveals differences, particularly in the larger proportion of costs from energy expenses faced by Indian tissue mills.
A snapshot of the average tissue machine and mill viability is shown in Figure 13. In this case, the cost of the bar height is determined by viability factors, where cost is only one of the eight factors considered. The legend shows these factors as capital required, cost, grade risk, internal company risk, competitiveness, size, technical age, and tons per unit trim. India, Bangladesh, and Nigeria have the worst viability scores. India’s deficiencies are the size of operations and low trim width, indicating lots of room for improvement.
India’s tissue consumption is on the rise, and its tissue production capacity is expanding to meet this demand. If India were to achieve the global average annual tissue consumption of 5kg per person, its tissue production capacity would need to increase by tenfold. This growth phase has already commenced, but there’s still a long way to go to reach the pace seen in China. While India’s tissue consumption has the potential for rapid growth, it’s unlikely it will receive the same level of government support and investment as China’s tissue sector. Indian tissue consumption requires more than just favourable consumer economics. Structural issues related to home and commercial hygiene facilities, cultural differences from Pakistan and Bangladesh, and consumer habits will take time to address. Therefore, we shouldn’t expect Indian tissue to develop at the same pace as China’s experience. Slower growth is more probable.
Tissue consumption estimation goes beyond a simple calculation. Developed economies have access to scanner data that directly measures the sales of each product. Notably, the United States is now missing some of this data due to confidentiality concerns from warehouse club stores with significant tissue sales.
A detailed understanding of tissue producers and individual machines is essential for analysing the competitive landscape. This article offers an overview of the current tissue industry in India. Fluctuations in fibre prices, exchange rates, and environmental regulations present both advantages and challenges for industry participants. Additionally, ownership changes and consolidations are expected to continue among tissue mills in India, while investments in tissue-making capacity from neighbouring countries could influence imports and exports.


