


Per capita GDP in several countries is higher than $15,000. Yet even there the various issues holding back development – unemployment, climate, inflation, conflict – show little signs of being resolved. By Bruce Janda, Senior Consultant, Fisher International.

Africa is a vast, diverse, underdeveloped consumer market of about 54 countries and over 1.4bn people. Economic development has stalled in many countries due to political instability, which makes financing new projects like tissue machines and converting lines difficult. Many African countries are still overly focused on exporting primary commodities instead of value-added manufacturing, which has limited employment and personal income gains. This has been exacerbated by closed economies, relatively high military expenditures, poor health and education, and land-locked tropical regions.
African tissue consumption rates per person have not grown as expected. Figure 1 (See Slide Show below Table 1, Figure 2 and 3) shows the apparent average tissue consumption development per person since 2007. Africans still use less than 1kg of tissue per person annually. This is far from the consumption rates in Latin America and Asia. Developing an African consumer economy and tissue consumption habits, as seen in many Asian countries, would result in ten times the current tissue consumption. This would provide significant opportunities for domestic producer expansion and growth for external tissue exporters. Unfortunately, this seems to be something we won’t see for decades. Therefore, this slow rate of development will make it challenging to expand African domestic tissue production rapidly, and influential established tissue producers with inexpensive fibre sources will provide strong external competition.
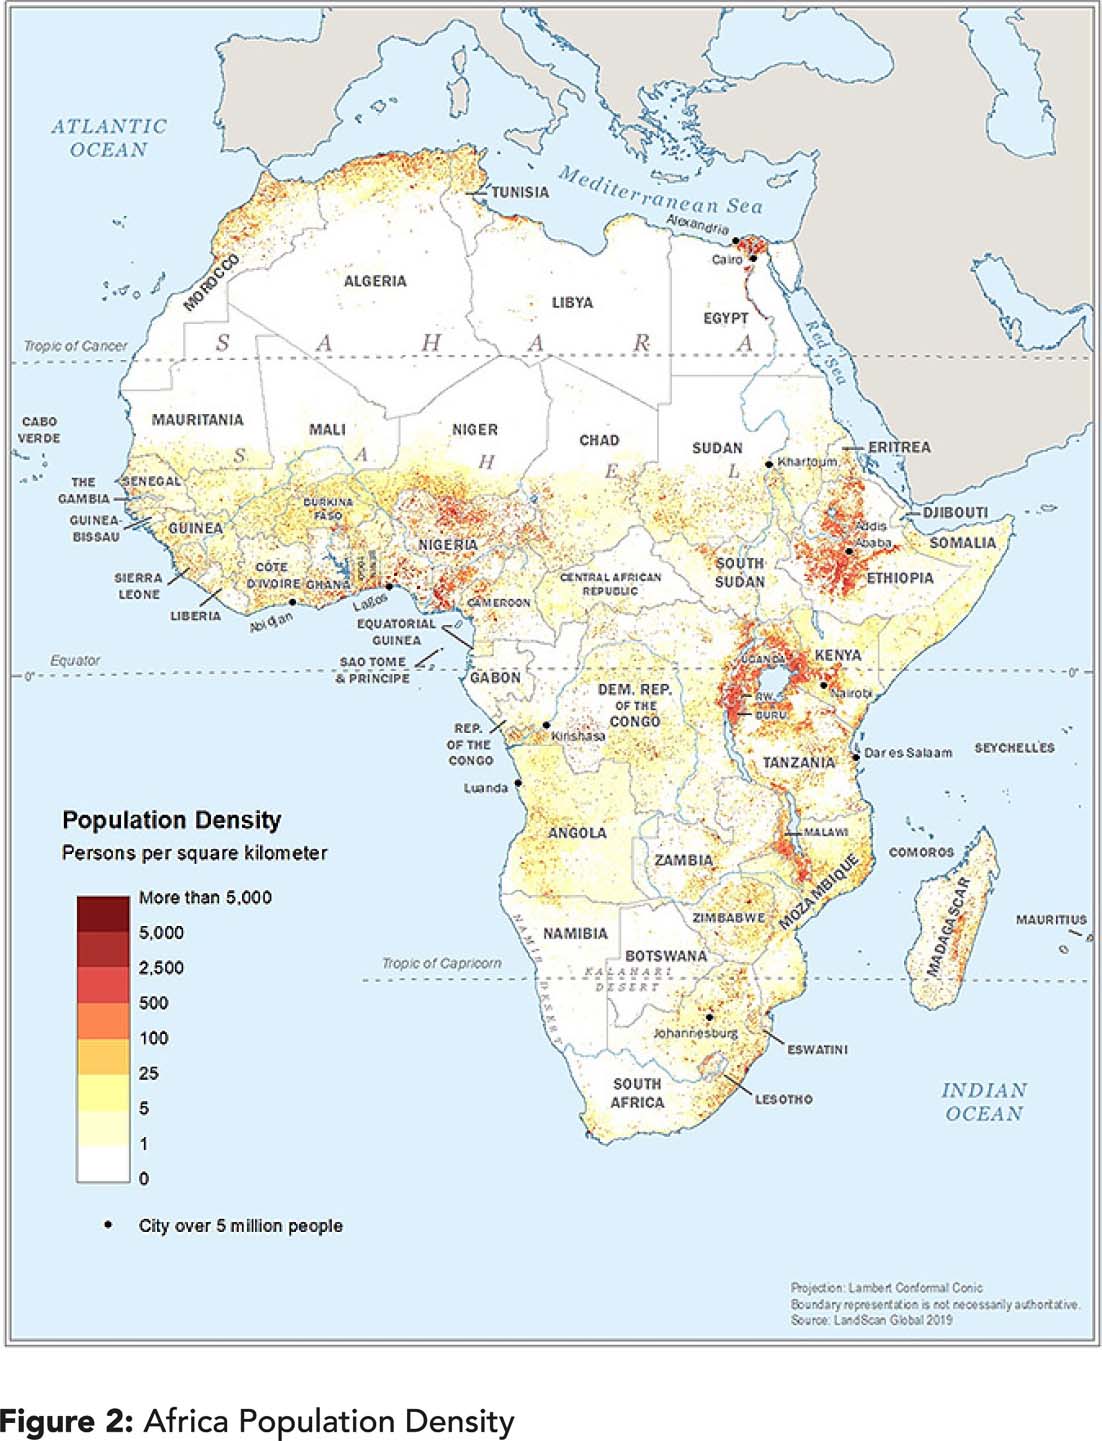
Africa’s population distribution is greatly affected by geography and climate, as shown in Figure 2. The population is centred in several large clusters and associated cities.
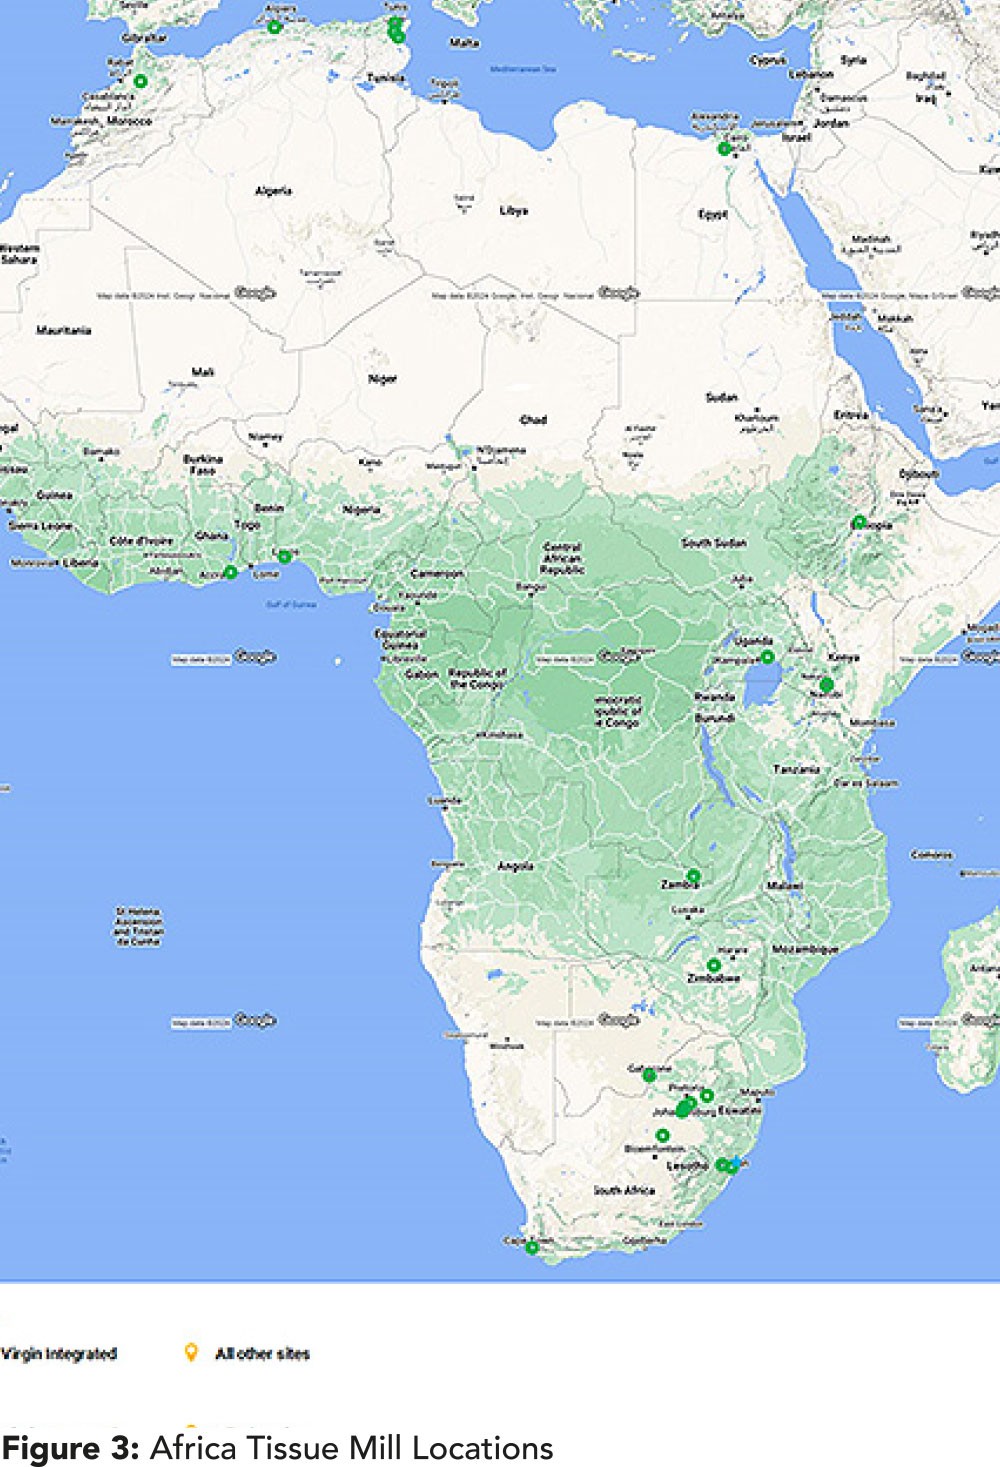
South Africa has the most mills and includes interior and coastal locations. Some 23 companies operate tissue machines in the whole of Africa, but only two are public corporations: Kimberly-Clark and SAPPI.
Other mills are distributed in 13 northern or western coastal countries, except for some inland mills in Ethiopia, Kenya, Uganda, Zambia, and Zimbabwe.
Africa’s population has doubled since 2007 to over 1.4bn, as shown in Figure 4. Over the same time, the average GDP per capita (adjusted for purchasing power parity) rose from $5,350 to $7,400, representing a 38% gain, as shown by the blue line. This population and personal income increase should have resulted in greater tissue demand.
Figure 5 provides a counterpoint to support increased tissue demand. Africa’s average unemployment was 21% at the beginning of the chart in 2007 and has been growing since, resulting in an over 26% unemployment rate in 2023. Region-average inflation is even more worrying, at about 16.5% in 2023. Both statistics indicate significant headwinds for developing increased domestic tissue demand.


Figures: 1, 4 to 15
The data shown in Figures 1-5 are averages of African data taken as a region. This is useful but does not show the diversity of economic outcomes by country and their impact on tissue demand. Global economic statistics depend on each country’s willingness to report economic and trade data to be compiled by the UN and published. Data is inconsistent, as definitions of unemployment and trade data are not universal.
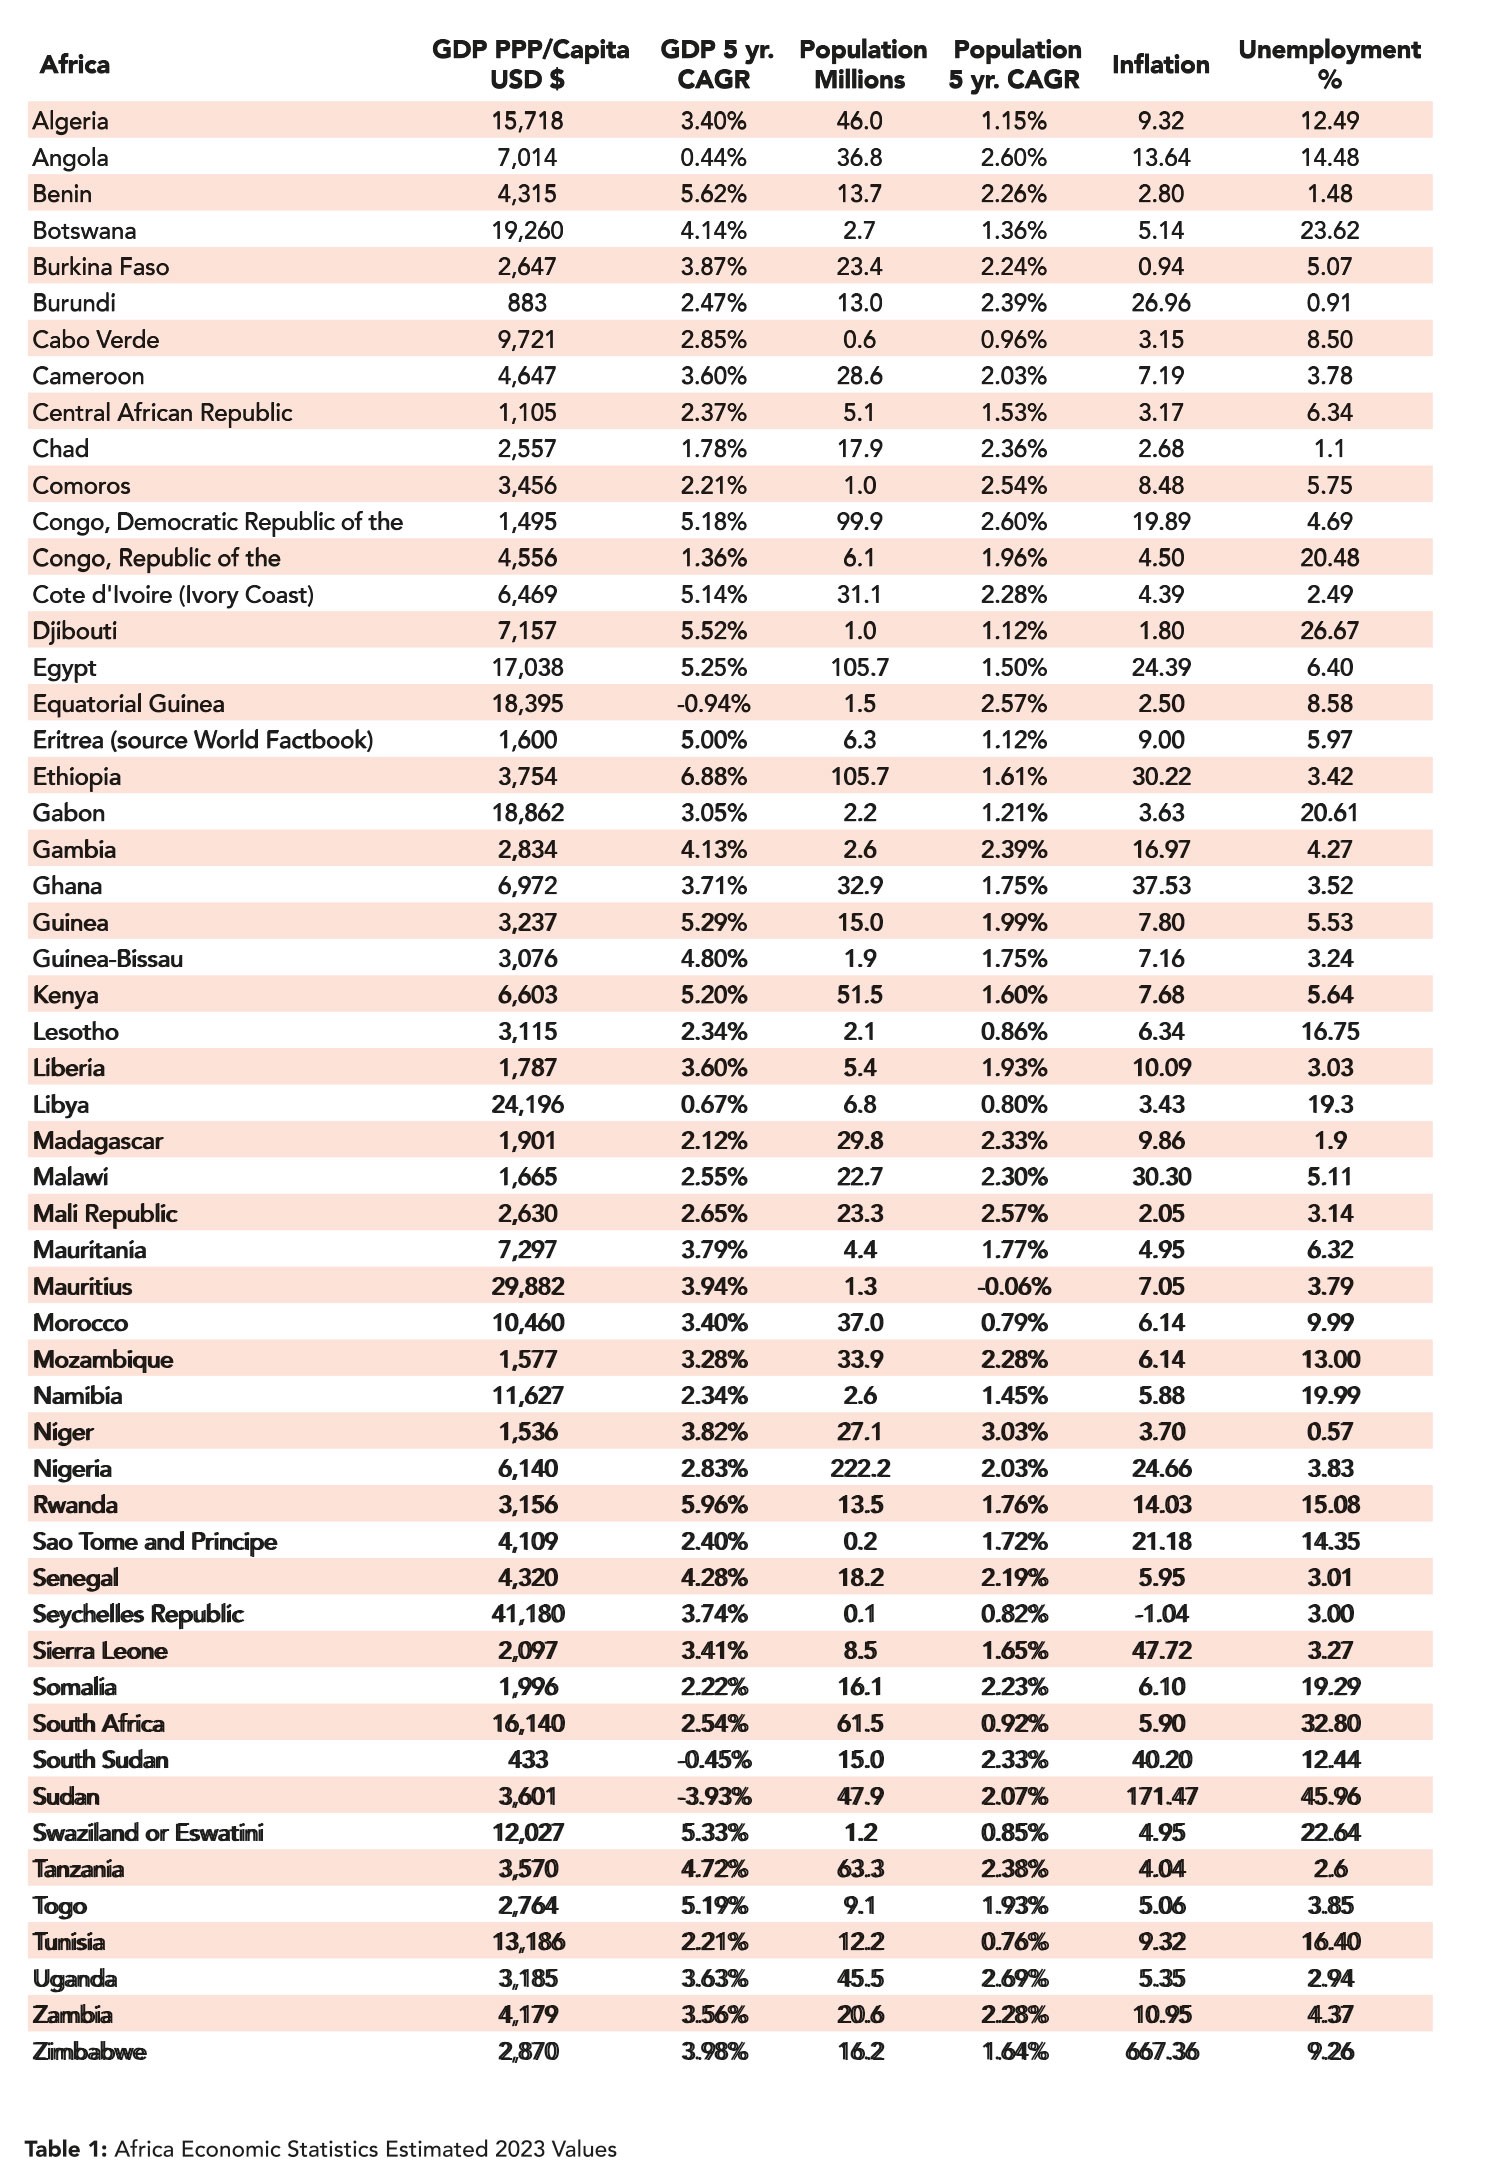
Economic data for each of the 54 African countries included in this report is shown in Table 1. This data was taken from FisherSolve’s Markets and Capacity Trends module and the World Factbook (cia.gov). Recent data for Algeria, Eritrea, Nigeria, and Sao Tome and Principe was unavailable in FisherSolve and was taken from the World Factbook. Data from several countries became sparse during and after the pandemic.
The countries of Algeria, Botswana, Egypt, Equatorial Guinea, Gabon, Libya, Mauritius, Seychelles Republic, and South Africa all have GDP per capita (adjusted for purchasing power parity) greater than $15,000 (USD) and probably support greater personal tissue consumption. Unfortunately, Egypt reports high inflation at 24.4%, while Botswana, Gabon, and South Africa report unemployment rates from 20% to 33%. Despite the higher income levels, this would slow tissue demand growth in these locations. Another group of countries ranks at the bottom of personal income with a GDP/capita of $2,000 or less. This group includes Burundi, the Central African Republic, the Democratic Republic of Congo, Eritrea, Gambia, Liberia, Madagascar, Malawi, Mozambique, Niger, Sierra Leone, and South Sudan. These locations are unlikely to participate in tissue demand growth until their economies grow.
African tissue imports from other regions are shown in Figure 6. This chart shows slow demand growth with increasing tissue imports from the Asia-Pacific region.
The continent’s tissue exports trend is shown in Figure 7. Note that the Y-axis, for imports, is three times the size of the exports chart for scale comparison. In this case, the regional export data also includes African intraregional trade as the blue bar segments. This shows increased tissue supply from African domestic producers to other African countries. Tissue exports to Europe and the Middle East are relatively small.
Africa’s tissue machine fleet count has been relatively stable, with new machines replacing shutdown, old machines throughout this trend, resulting in a net increase of one additional machine, as shown in Figure 8. The compound annual growth rate for African-based tissue production over the same period is 4.38%. This includes not just new machines but also capacity improvement projects.
Almost all African tissue mill sites are partially integrated with paper fibre recycling plants, as shown in Figure 9. The lone exception is a partially virgin fibre integrated site operated by SAPPI in KwaZulu-Natal, South Africa.
Figure 10 shows the tissue products produced in Africa organised by the finished product and the furnish description. As expected, consumer bath represents 75% of total production, typical in an underdeveloped tissue market. There is less opportunity for conveniences like facial tissue, napkins, or paper towels. The largest furnish sources are recycled paper (unbleached, not-deinked, unbleached and deinked, bleached and deinked). Not every site is fibre self-sufficient, so significant market pulp is imported. Eucalyptus is the most common pulp import, followed by Northern Harwood, Southern Softwood, and Northern Softwood.
Figure 11 uses a bubble chart to examine African tissue machine quality. The size of each bubble corresponds to the relative tissue production for each producing country. South Africa, Tunisia, Egypt, and Nigeria have the largest tissue businesses by volume.
The Y-axis shows the average machine speed in metres per minute. Most world-class machines today run well over 2,000 meters per minute, so these averages are quite low.
The X-axis shows the average tissue machine technical age for each country. This indicates what generation technology is available for product development or cost reduction. The average African tissue machine is about 20 years old. This makes the relatively new Uganda machine stick out. However, the machine speed is so slow that it suggests that the technology employed is not world-class.
Figure 12 shows the same chart, but three potential tissue export nations are included to provide a more global competitiveness assessment: Türkiye, Indonesia, and Brazil. Here, we see the tremendous volume of tissue produced in each country, which tends to outweigh all of Africa several times over. These tissue machines are, on average, relatively newer and run faster than most African machines. Indonesia and Brazil are also huge wood pulp producers and are moving toward integrating their tissue machines with pulp production. Türkiye has focused on developing a tissue export business based on pulp imported into the market.
The same countries are included with Africa in Figure 13 to compare the average cash cost of producing a ton of tissue. The height of each country’s bar represents the cash cost of production, and the width of each bar is the relative tissue capacity. The coloured bands for each bar represent the costs of raw fibre material, market pulp, chemicals, energy, labour, materials, overhead, and credits.
The massive volume of tissue produced in Indonesia, Brazil, and Türkiye is shown in the bars’ width, representing the average production cost in each country. Türkiye suffers from inflation and high costs from using market pulp, but they would probably argue that their products are worth higher margins. Energy costs in South Africa and Türkiye stand out as a competitive disadvantage. Both countries have used coal power for electricity and mill boilers.
A snapshot of the average tissue machine and mill viability is shown in Figure 14. In this case, the cost of the bar height is detailed by viability factors, where cost is only one of the factors. The legend shows these factors as capital required, cost, grade risk, internal company risk, competitiveness, size, technical age, and tons per unit trim. Most countries do well in this comparison, positioned at the lower end of this set, led by Türkiye, Indonesia, Tunisia, and Brazil. At the right-hand end of the chart, Uganda, Morocco, Zimbabwe, Zambia, and Kenya show significantly higher risk scores.
Figure 15 displays carbon emissions per finished metric ton, explicitly focusing on emissions from tissue machines on-site and excluding pulp production at integrated sites. Scope 1 and 2 emissions were chosen as they are most likely to be included in a carbon analysis by potential consumers. The colours stacked in each bar represent the source of each emission. The two key areas are fossil fuel consumption on-site for power and heat during tissue drying and the fossil fuel content of electricity grid production.
In several African countries, tissue production is relatively low in carbon. Uganda and Ethiopia have slightly lower carbon intensity than Brazil. However, Brazil is one of the best tissue industries for low-carbon intensity. Morocco, Zimbabwe, and South Africa have the highest carbon intensity in the continent.
Africa remains an underdeveloped region in the global tissue business. Consumer tissue demand is developing slower than expected. Political and economic insecurity appears to have been increasing in the past 25 years, putting more and more people at risk for basic survival in famine and war. The result is much slower development of consumer demand for products that make life better, like tissue.
Africa’s diverse peoples, languages, and cultures complement the region’s diverse climates and geography. Not every country is in the same situation. We should expect the demand for tissue products to grow at different rates. The countries with better economic environments will accelerate and leave the others behind. Africa is not developing as a region, and general tissue demand may spread more slowly than we see in Asia.
Analysis of competitive position requires specifics on tissue producers and individual machines. This article presents a static summary of Africa’s tissue industry today. Fibre prices, exchange rates, and environmental regulations will change, providing some participants advantages and new challenges. In addition, Africa’s tissue mills will continue to change hands and consolidate, and neighbouring countries may invest in tissue-making capacity, affecting Africa’s imports and exports.

