


By Bill Burns, senior consultant, Fisher International
The United Kingdom (UK) produces approximately 860 thousand mt/yr of Towel and Tissue (T&T) paper. That makes the UK the fourth largest T&T producing country in the European Union (EU) with about 10% of the EU capacity. The UK was particularly hard hit by the 2008/09 economic downturn. Austerity measures were put in place to lower deficits. In 2012, weak consumer spending and subdued business investment weighed on the economy. GDP fell and the budget deficit remained stubbornly high. The T&T business went through a similarly tough period. Market conditions led to line rationalisations and the UK experienced a dramatic drop in operating capacity (Figure 1). The decline in business, starting in 2008, resulted in the UK dropping from the second largest producer in the EU to fourth largest.
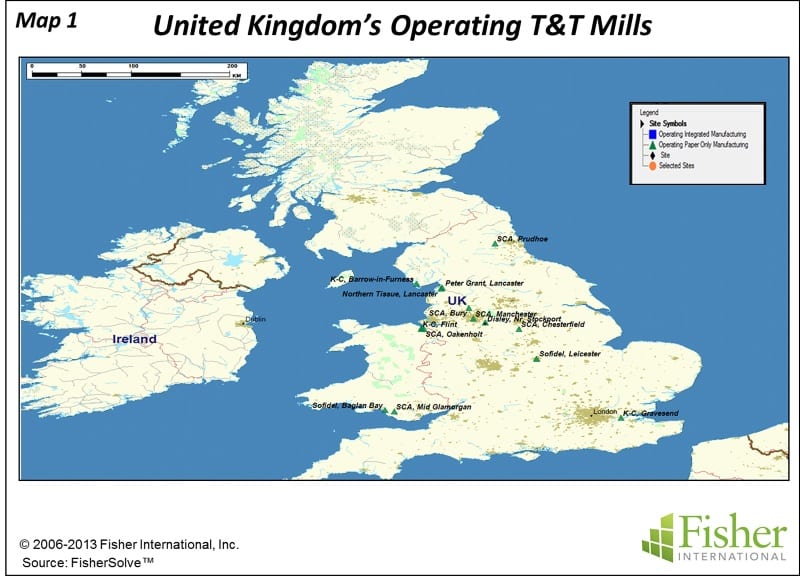

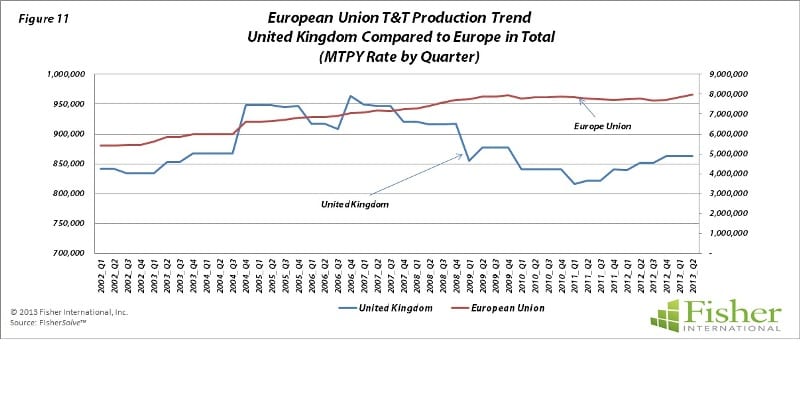

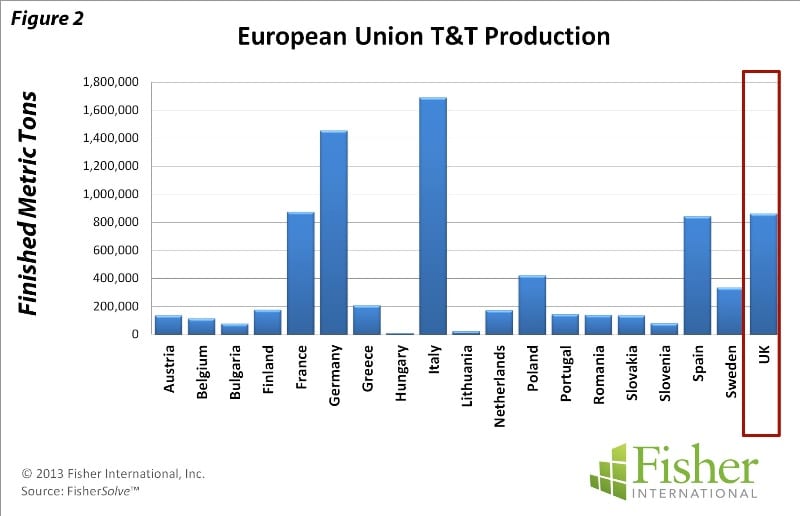

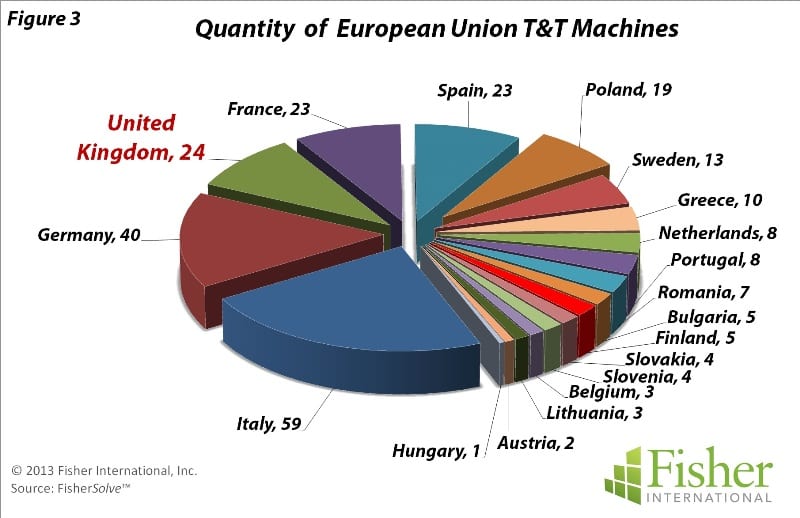

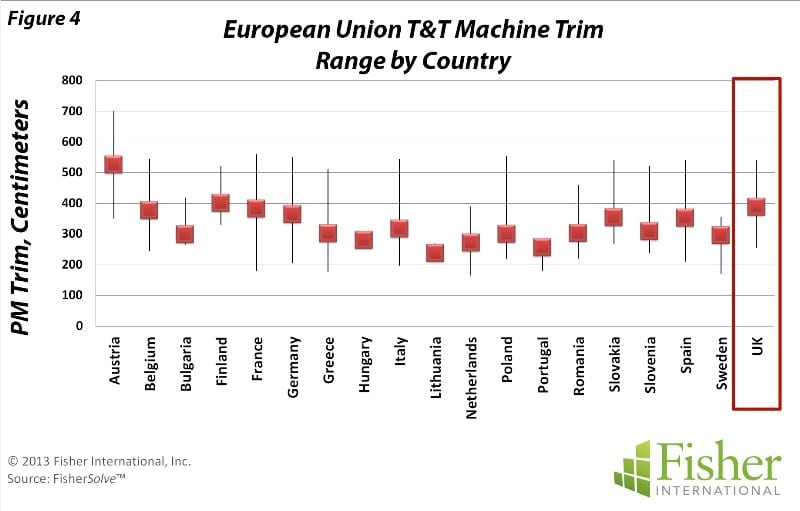

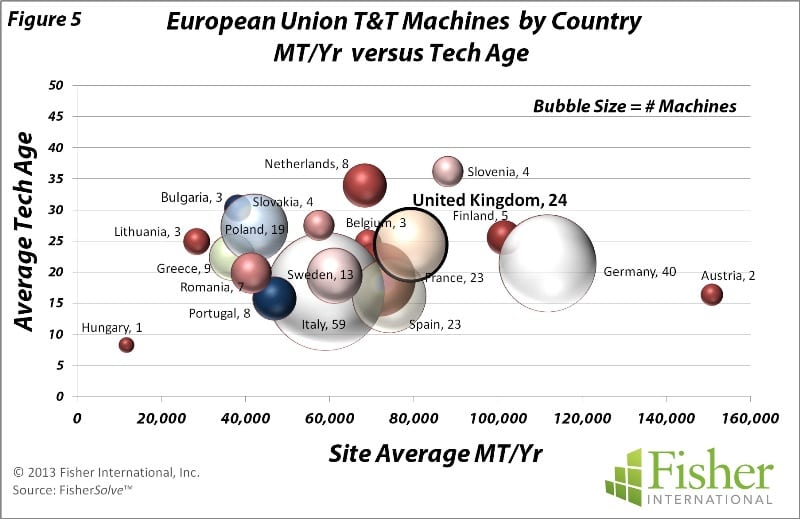


The UK T&T mills are geographically dispersed throughout England and Wales. The UK ranks fourth among T&T producers in the EU (Figure 2) and third in the number of operating machines (Figure 3). T&T machines in the EU vary from narrow two-metre machines to six metres. Machines in the UK are typical in terms of the trim range for the region, with the average being 3.9 metres (Figure 4). Mill production in the UK is, on average, on the high side compared to other producing countries in the EU at nearly 80,000 mt/yr while the technical age of UK machines is a little above average (Figure 5).
‘Market conditions led to line rationalisations and the UK experienced a dramatic drop in operating capacity.’
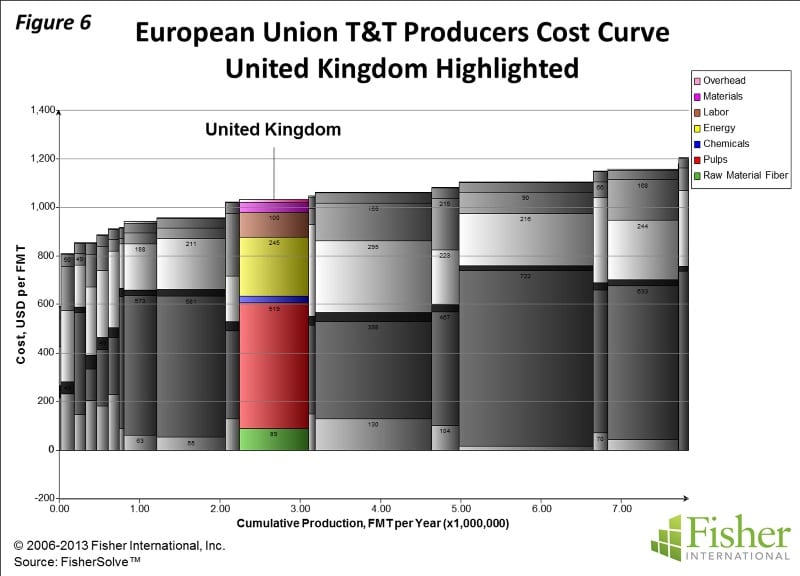
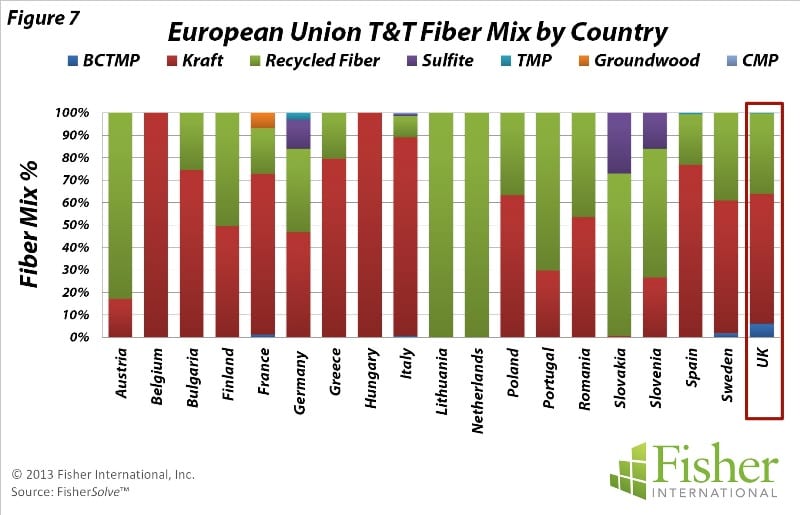
The UK cost position in the EU is slightly advantaged by the integration of recycled fibre in its furnish mix and by competitiveness against some of the larger producing countries with energy and labour costs (Figure 6). Fibre mix in UK mills is 35% recycled fibre with the remaining being market kraft pulp and some CTMP (Figure 7). While recycled fibre is present in mostcountries, it is not in heavy use by major producers. Integrated recycled fibre does provide some smaller producing countries an advantage over the purchased fibre consumed by larger producing countries.
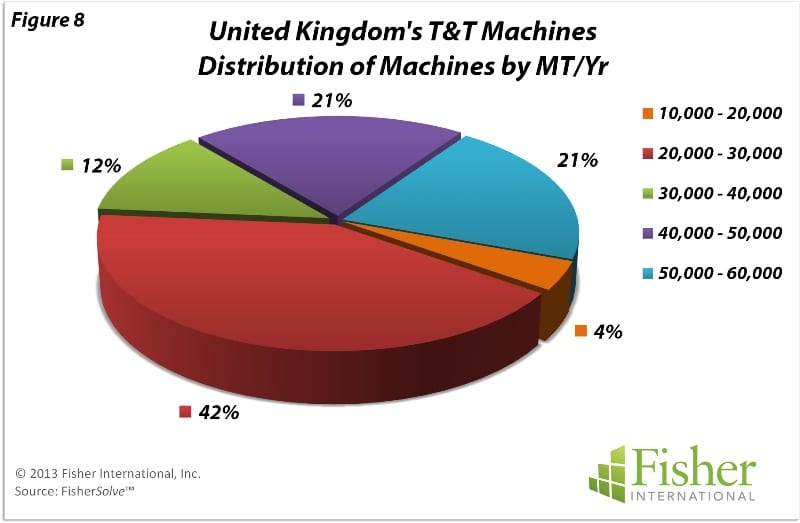
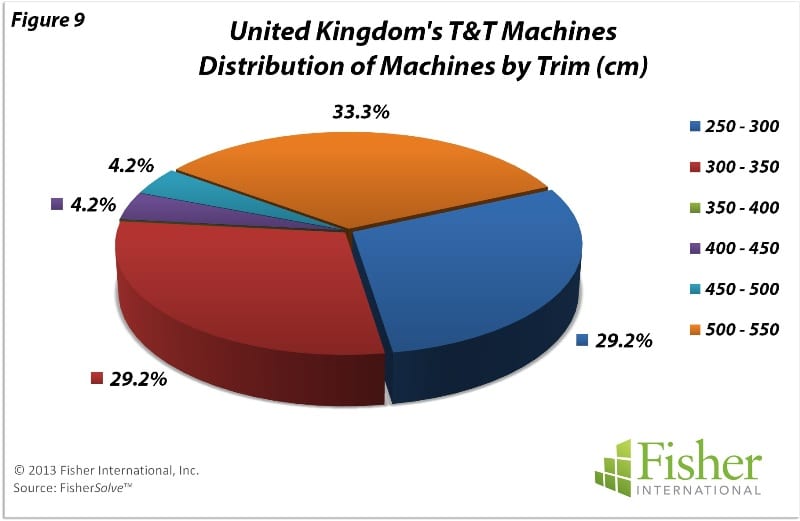
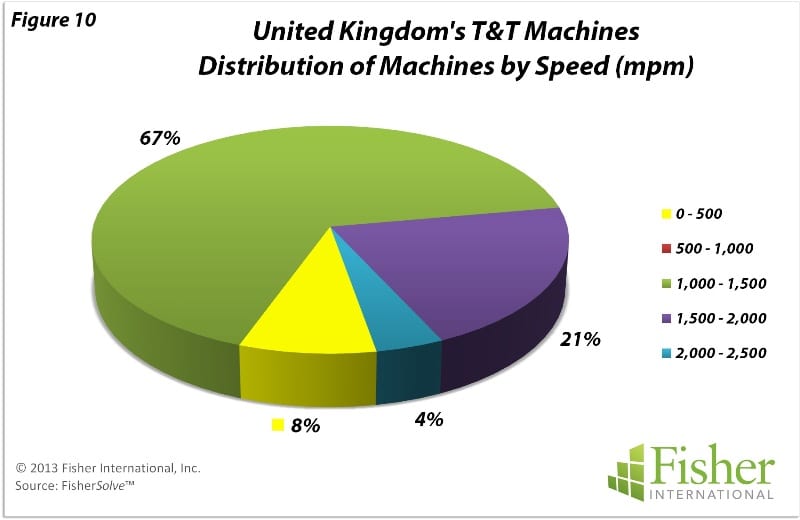
UK T&T machine production rates are split between machines ranging among the smallest, producing less than 30,000 mt/yr, and those at more moderate levels, producing in the 40,000 – 60,000 mt/yr range (Figure 8). Machine trims are narrow with more than half of the machines being less than 3.5 metres (Figure 9). About a third of the machines are wider falling in the 5.0 – 5.5 metre class. Machine speeds are in a respectable spectrum with nearly 70% of the machines in the 1,000 -1,500 mpm range (Figure 10). Some 25% of the remaining machines operate at higher speeds in the 1,500 – 2,500 mpm range. On the international scale, UK machines tend to cluster around the average capacitywise, with a good number above average. Age of machines has a wide age of UK machines is a little above average (Figure 5).
‘Fibre mix in UK mills is 35% recycled fibre.’
The UK cost position in the EU is slightly advantaged by the integration of recycled fibre in its furnish mix and by competitiveness against some of the larger producing countries with energy and labour costs (Figure 6). Fibre mix in UK mills is 35% recycled fibre with the remaining being market kraft pulp and some CTMP (Figure 7). While recycled fibre is present in most countries, it is not in heavy use by major producers. Integrated recycled fibre does provide some smaller producing countries an advantage over the purchased fibre consumed by larger producing countries.
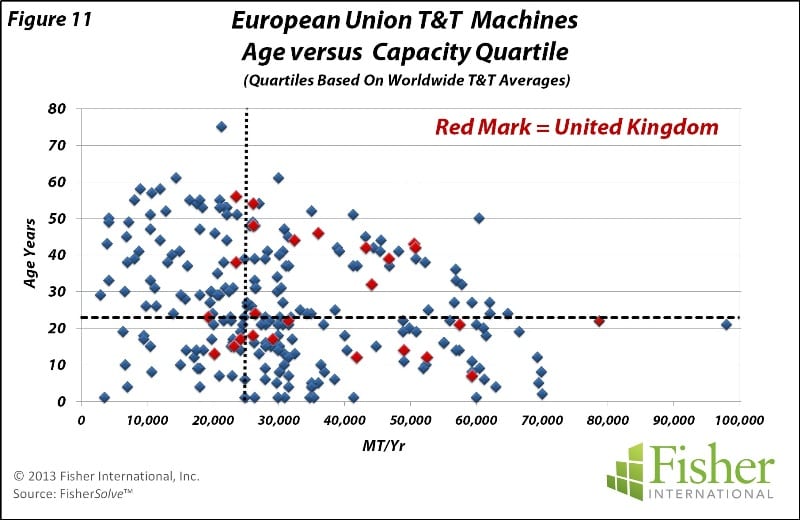
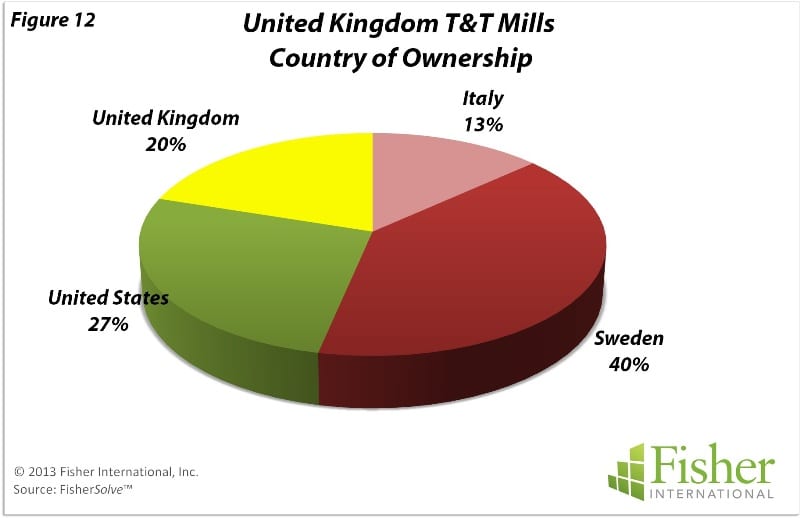
UK T&T machine production rates are split between machines ranging among the smallest, producing less than 30,000 mt/yr, and those at more moderate levels, producing in the 40,000 – 60,000 mt/yr range (Figure 8). Machine trims are narrow with more than half of the machines being less than 3.5 metres (Figure 9). About a third of the machines are wider falling in the 5.0 – 5.5 metre class. Machine speeds are in a respectable spectrum with nearly 70% of the machines in the 1,000 -1,500 mpm range (Figure 10). Some 25% of the remaining machines operate at higher speeds in the 1,500 – 2,500 mpm range. On the international scale, UK machines tend to cluster around the average capacitywise,with a good number above average. Age of machines has a wide dispersion above and below average (Figure 11). A noteworthy observation is that the UK’s T&T business is international in ownership with 80% of the mills being headquartered outside of the UK (Figure 12).
[box]
The source for market data and analysis in this article is FisherSolve™. Data tables behind Figures 1-12 can be obtained from Fisher International. Email requests to [email protected].
About Fisher International, Inc.
Fisher International has supported the pulp and paper industry for over 25 years with business intelligence and management consulting. Fisher International’s powerful proprietary database, analysis tools, and expert consultants are indispensable resources to the industry’s producers, suppliers, investors, and buyers worldwide.
FisherSolve™ is the pulp and paper industry’s premier database and analysis tool. Complete and accurate, FisherSolve is unique in describing the assets and operations of every mill in the world (making 50 TPD or more), modeling the mass-energy balance of each, analyzing their production costs, predicting their economic viability, and providing a wealth of information necessary for strategic planning and implementation. FisherSolve is a product of Fisher International, Inc. For more information visit: www. fisheri.com or email [email protected] USA: +1-203-854-5390.
[/box]


