


By Subhash Deodhar
Globally, tissue and towel production emits more carbon per tonne of paper than any other paper grade. For a product so close to the end-consumer, the carbon footprint of the category and of individual producers is a potentially serious issue. Fisher International’s senior consultant Subhash Deodhar talks to TW about how tissue mills can reduce their footprint.
“It is becoming increasingly important for owners and their stakeholders to understand the relative position of each of their assets compared to their peers.”
The carbon issue has the potential to alter the competitive position of individual mills.”
 Worldwide, the paper industry is responsible for approximately 1.4% of humanity’s carbon or greenhouse gas (GHG) emissions (half a billion of the world’s 36 billion tonnes of carbon emitted annually). While the full impact of carbon issue for the industry may not be clear, mill owners are already accounting for the future potential of relatively expensive carbon taxes and other forms of penalty as they decide which assets to select for investment and which to close.
The possibility that consumer advocacy on the issue will increase in strength affects decisions on which products companies create, how they market them, and where and how companies invest in manufacturing plants and equipment.
It is becoming increasingly important for owners and their stakeholders to understand the relative position of each of their assets compared to their peers. Fisher International has calculated the GHG emissions of every operating mill and machine in the world for each of the products it produces including Towel and Tissue (T&T). This data was used to profile carbon emissions in T&T manufacturing for this article.
While other industries, such as cement, emit considerably more carbon than pulp and paper, the paper industry’s contribution to global emissions is large enough to attract the attention of society and governments. And, to the extent that the general public and governments choose to penalise carbon emissions, pulp and paper’s GHG volume is large enough to have a significant financial impact on many of the industry’s players.
So far, the impact of the carbon on paper mills has been relatively small and uneven. Some mills may pay small amounts of penalties while others actually benefit from Renewable Energy Credits (RECs) they earn and are allowed to sell when they produce energy from renewable fuels. The carbon issue, however, has the potential to alter the competitive position of individual mills and paper companies. Consumers are increasingly concerned about global warming threats and inclined to prefer products that can claim to be carbon neutral. Governments throughout the world, both local and national, are considering instituting a variety of disincentives for carbon emissions. Moreover, the wide range of penalties under consideration, if instituted, could affect mills in wildly varying degrees.
The Carbon Benchmarking Database calculates the GHG emissions of every operating mill and machine in the world for each of the products it produces. It displays data on fossil fuel combustion (Scope 1), purchased electricity (Scope 2), and purchased raw materials and fuels (Scope 3). Using the rollup functionality, a user can compare the carbon footprints of machines, mills, companies, countries, regions, finished product, etc, and any combination of these variables.
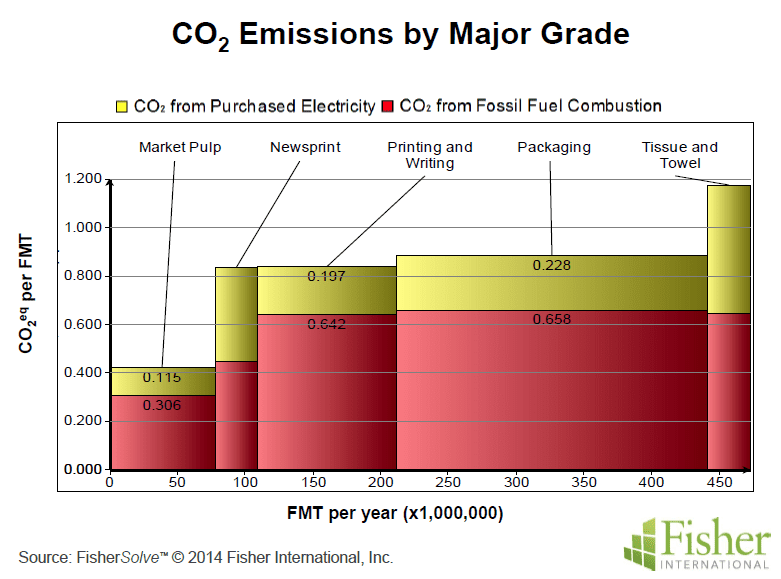
Figure 1 illustrates the CO2 emission intensity of T&T grades as compared to other major grades. The bar width is in proportion to the worldwide capacity of each grade. It is evident that T&T production emits more carbon per tonne of paper than any other grade. For a product so close to the end-consumer, the carbon footprint of the category and of individual T&T producers is a potentially serious issue.
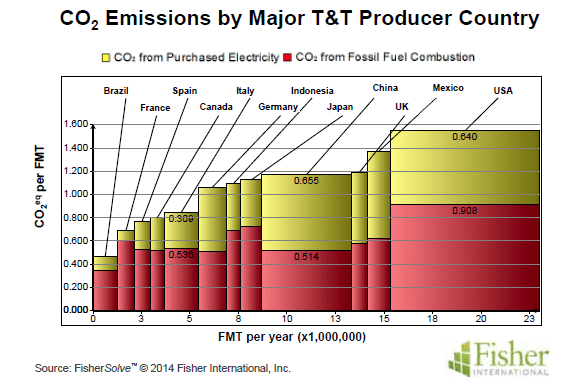
Twelve countries account for 80% of worldwide T&T production. Figure 2 compares the carbon emissions of T&T paper mills in these countries. The bar width is in proportion to each country’s T&T capacity. Clearly, there are very large differences in carbon emissions between countries, a potential issue in those areas where exports between countries are possible.
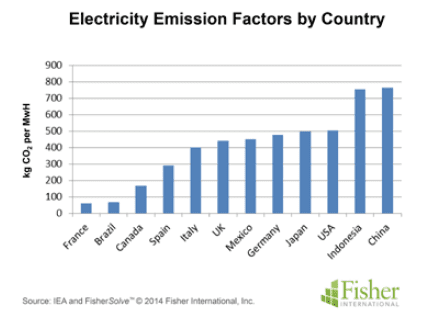
Electricity emission factors vary substantially by country. Figure 3 has the most recent electricity emission factor data from the IEA for the twelve largest producers for T&T grades. Coal burning power plants (China and Indonesia) have the highest emission factors. Nuclear power plants (France) lead to very little CO2 emission. Use of biomass as power plant fuel (Brazil) generates CO2 but it is not counted as greenhouse gas emission since biomass is considered carbon neutral.
Tissue and towel mills can take various measures to reduce their carbon footprint:
• Energy conservation – which also leads to cost savings
• Investment in energy efficient technologies – initial capital costs but can pay off over time
• Use of natural gas instead of coal or oil – which results in about 42% reduction in CO2 emission per unit of energy
• Use of biomass fuels instead of fossil fuels – no GHG emission associated with biomass fuels. Cost and availabil-
ity of biomass fuels are certainly important factors. It may also require investment for equipment modifications to facilitate use of biomass fuels
[box]About FisherSolve’s Carbon Benchmarking
FisherSolve’s Carbon Benchmarking module calculates carbon emissions from “cradle-to-gate” and even “cradle-to-destination” for every mill and machine in the world. It accounts for all the carbon emissions from making each finished product on each machine including carbon associated with the manufacture and transport of raw materials; the production, transport, and combustion of fuels in the mill; the purchase of electricity; and the transport of parent rolls to any of 100 destinations in the world.
Since the mass-energy balance engine behind FisherSolve already models all of the necessary fuels and other ingredients, the CO2 emission figures in the Carbon Benchmarking module can be broken down in many ways and are entirely consistent with the cost and asset data in the rest of FisherSolve. The model allows analysis down to the paper machine-finished product level and can roll up analysis to any level above. This tool creates standardised consistency when considering policy and commercial issues. For more information, please visit www.fisheri.com or call +1 203 854-5390. [/box]
vary substantially from country to country
CO2 OVERVIEW
GHG terminology and definition
Greenhouse gases relevant to the paper industry are Carbon Dioxide (CO2), Methane (CH4) and Nitrous Oxide (N2O). GHG emissions are generally reported as mass of Carbon Dioxide Equivalent (CO2eq). Instead of reporting separately for methane and nitrous oxide, their equivalent CO2 emission (in proportion to their impact on climate change) is calculated and added to CO2 emission to obtain the total CO2eq emission. The common reporting unit is a metric tonne of CO2eq, but often stated simply as tonnes of carbon dioxide. Emission intensity (tonnes of CO2 emission per tonne of production) is the term commonly used to compare different manufacturing sites or product lines.
GHG Emissions Classification
Fisher International’s Carbon Benchmarking tool displays data on Scope 1, Scope 2, and Scope 3. It also allows for combinations such as “Gate-to-Gate” (Scope 1 and 2) and “Cradle-to-Gate” (all three Scopes together). Users can analyse the carbon footprint at any level.
At the very basic level, greenhouse gas emissions are classified into direct and indirect emissions. The Greenhouse Gas Protocol (GHG Protocol) defines them as follows:
Direct GHG emissions are emissions from sources that are owned or controlled by the reporting entity. Indirect GHG emissions are emissions that are a consequence of the activities of the reporting entity, but occur at sources owned or controlled by another entity. These direct and indirect emissions are further categorized into three broad scopes, based on sources of emissions:
• Scope 1: All direct GHG emissions. Combustion of fossil fuels is the major source of direct emission. Also included in Scope 1 are onsite waste treatment and landfill facilities for emission of carbon dioxide and methane respectively. CO2 emissions from combustion of fossil fuels are calculated using emission factors for individual fuels. The Intergovernmental Panel on Climate Change (IPCC) has published emission factors for most common fossil fuels used by industry. Emission factors are generally expressed as kg of CO2 emission per GJ of calorific value of fuel.
• Scope 2: Indirect GHG emissions from consumption of purchased electricity, heat or steam. Emission factors for purchased electricity are generally expressed as kg of CO2 emission per MwH of electricity. Emission factors vary by electricity supplier. The most common method is to use an emission factor for each country. The International Energy Agency (IEA) compiles purchased electricity emission factors by country. IEA updates the data yearly.
• Scope 3: Other indirect emissions, such as the extraction and production of purchased materials and fuels, transport-related activities in vehicles not owned or controlled by the reporting entity, electricity-related activities (e.g., T&D losses) not covered in Scope 2, outsourced activities, waste disposal, etc.
Regulatory Incentives and Penalties
Various forms of incentives and penalties have been proposed to control and reduce GHG emissions. Penalties can be either in the form “carbon cap-and-trade” or “carbon tax.” For cap-and-trade, each industrial site is allocated a permissible carbon emission for a base year and target reduction for subsequent years. The site has to buy credits if it emits more than its quota or can sell credits if it emits less than its quota. The trading occurs at carbon exchanges. The European Union’s ETS operates in the 28 EU countries and covers around 45% of the EU’s greenhouse gas emissions from power generation and manufacturing industries. In North America, the Chicago Climate Exchange is the largest and longest running greenhouse gas emission trading platform. China has recently opened an Environmental Exchange site for carbon trading. Carbon Trade Exchange (CTX) is promoted as a Global Electronic Carbon Credit Exchange Platform.
The carbon tax system is a direct tax collected during the sale of fossil fuels. The tax is based on tonnes of carbon dioxide that will be emitted by the fossil fuel being sold once it is burned. A few countries have had direct carbon tax in place for a few years. Examples and their approximate tax rates are Sweden ($23/tonne), Finland ($27/tonne) and Australia ($23/tonne). Canada does not have a national carbon tax but Quebec ($2/tonne) and British Columbia ($30/tonne) have had carbon taxes in place for the past several years. In the USA, various bills have been proposed in US Congress. The most recent bill is the “Climate Protection Act of 2013”. The bill proposes carbon tax starting at $20/tonne and rising over a decade to $33/tonne.


