


By BTG’s Florent Bougerolle
 BTG’s Florent Bougerolle talks to TWM about how doctor blade vibration monitoring helps tissue makers get valuable insight into costly coating upsets and Yankee chatter problems
 BTG’s Florent Bougerolle talks to TWM about how doctor blade vibration monitoring helps tissue makers get valuable insight into costly coating upsets and Yankee chatter problems
Significant financial losses are involved in Yankee repair following a severe episode of chatter. Occurring on average up to once every year on a problematic Yankee, each regrind gets it closer to de-rate point, jeopardising production sustainability.
Doctor vibration monitoring is now a popular means for tracking risky process conditions and anticipating chatter episodes [1], although its effectiveness may be limited by the type of data provided and how it is analysed. Through this article, we will review the fundamentals of understanding vibration, clarify the principle of adequate vibration measurement and analysis and then give recommendations to improve the user’s vibration monitoring capabilities.
Measuring and representing vibration correctly
It is well-known that chatters results from vibration generated by friction between the Yankee surface and creping or cleaning doctor [2][3]. Vibration severity is influenced by various process factors, and the consequence of vibration manifests itself as a series of critical frequencies spread over the 0 to 20 kHz r ange. Periodic visual inspection with a strobe light and a written or verbal description of the observations are an unreliable means to evaluate the level of dangerous vibration and its evolution.
To accurately measure vibration, acceleration of the blade tip is the most suitable parameter to monitor as, unlike velocity, it is specifically adapted to high frequency vibration characterisation found in chatter phenomenon. Acceleration, measured in g gravity (1g equal to 9.80665 m/s2), is the rate of change of velocity and is proportional to the forces that cause oscillation.
‘Vibration monitoring system enables also to picture coating behaviour’
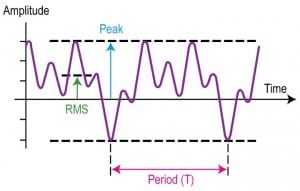
Severity or magnitude of the oscillation is called amplitude and is measured in two ways (Fig. 1):
- Root Mean Square Amplitude (RMS): As the vibration is an oscillation around an equilibrium point, a conventional average would give a value of zero. Thus, the square root of the average of the squared values of the waveform (amplitude vs. time) is used. RMS provides a global idea of the vibration severity.
- Peak: Gives the highest vibration amplitude of a waveform for a given period of analysis, generally hidden through average of RMS calculation. Peak is usually used to troubleshoot vibration measurement sensors.
But chatter vibration is also characterised by its frequencies, or the rate at which the doctor blade tip oscillates. Analysis of the spectrum of blade vibration signals (Fig. 2) allows us to observe dominant frequencies, harmonics, bandwidth, and other spectral components of a signal that are not easily detectable in time domain waveforms.
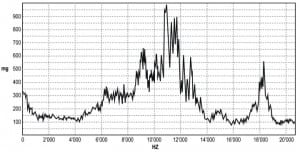
Practically, the spectrum is a graph which displays critical frequencies at which the blade is vibrating, together with the amplitudes of each of them, also called the vibration signature.
Specifically on tissue machines, and depending on process conditions, the spectrum can show high amplitude at mid-range frequencies usually related to edge contamination and/or high amplitude at high frequencies indicating a problem of hard coating.
Several other frequencies can be also identified through the spectrum, indicating the particular initiator of vibration that can generate chattermarks. Yankee gear box problems, press bouncing, creping and cleaning blade friction, hood pulsations, and related Yankee internals problems [4] can be then identified, leading to an appropriate correction plan. The spectrum is therefore a precious tool to identify main vibration sources over the array of underlying initiators in the process.
Right accelerometer = right information
To measure vibration amplitude and to catch the signature of the tissue machine doctor, IEPE (Integrated Electronic Piezo Electric) accelerometer sensors are today’s best technology [5]. Sensors should meet following specifications:
- Resonance frequency of sensor should obviously be over 22 kHz so outside the measuring range. If lower, sensor may enter in resonance at this specific frequency, vibrating itself and adding artificial intensity in the blade vibration amplitude.
- Sensitivity is the amount of change in output signal (volt) for a given change in acceleration (g). A higher sensitivity accelerometer will be more precise and probably more accurate, but usually have a reduced dynamic range. A too-low sensitivity increases the risk that the signal is weak and lost into electrical noise caught by the sensor cable. (Fig. 3)
- Dynamic range is the range between the smallest and the largest acceleration detectable by the accelerometer before overloading the output signal. In tissue machines, 80g peak or below dynamic range sensors should then not be used to avoid inducing the overloading issue. (Fig. 3)
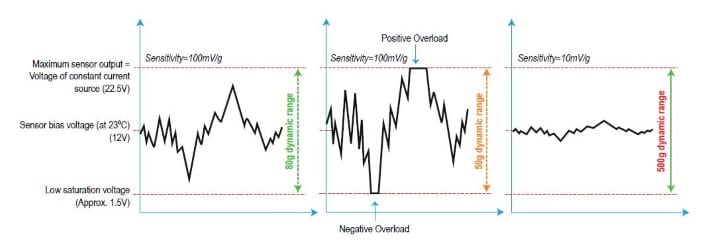
Overloading is in fact a critical source of false signals [6]. When the sensor is overloaded, the signal generated by the integrated amplifier of piezoelectric material is distorted and delivers a value unrelated to the amount of vibration. As a result, the spectrum usually shows a very high low-frequency peak with progressively decreasing amplitude over the high frequency vibrations, called a “Ski Slope”.
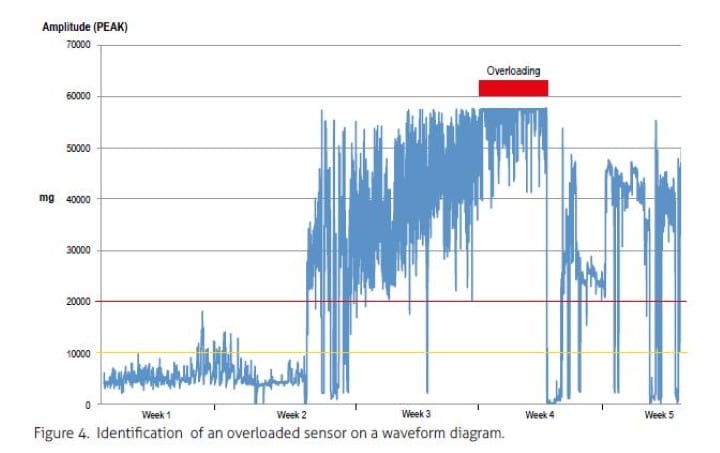
On a waveform diagram, overloading is characterised by a truncated signal of the vibration peak value at dynamic range limit. Overloading may be solved first by adjusting the sensor’s dynamic range, but also by reducing the source of vibration.
Regarding mounting, the sensor should ideally be measuring vibration in a direction perpendicular to the Yankee surface, to catch vibration related to blade tip displacement. In most cases, a solid plate below the blade holder clamping is a great location. Two or more sensors can be mounted per blade holder but this does not guaranty that vibration can be localised with better precision.
Vibration levels
Another important step for performing efficient vibration monitoring is the definition of smart levels – for warnings and alarms – which should trigger counteractions and corrective measures. However, existing standards such as ISO 10816 are not adapted to tissue machine blade friction vibration. The wide range of tissue machine configurations and equipment prevents defining a general admissible level of vibration severity. Vibration signature reveals that some critical frequencies are more important to consider than other ones.
Best practice is, therefore, to follow critical ranges of frequencies corresponding to process problems identified by a machine audit and then to set warning and alarm levels based on past trends and vibration reduction objectives. Let us now look at a real case, and see how this is developed in practice by experts with experience specific to vibration events on tissue machine doctors.
Analysis of spectrum and definition of specific bandwidth indicators
All machines are unique with specific equipment, processes, behaviour, and vibration signature. Thus vibration monitoring configuration requires a customisation explained below.
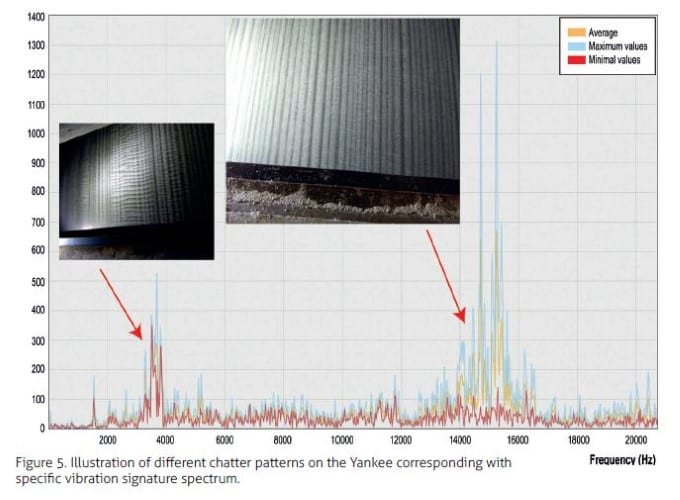
In our example, to start the process, the spectrum from the blade holder sensor signal is studied to determine vibration signature of the machine under various process conditions. Observation of the stationary Yankee surface completed by a process audit and further vibration spectrum surveillance enables us to identify 2 main types of vibration pattern. These correspond to Yankee condensate extraction and hard coating issues. On this spectrum (see Fig. 5), this corresponded to a low-frequency vibration located between 2.8 to 3.8kHz, and to a high- frequency vibration around 14kHz.
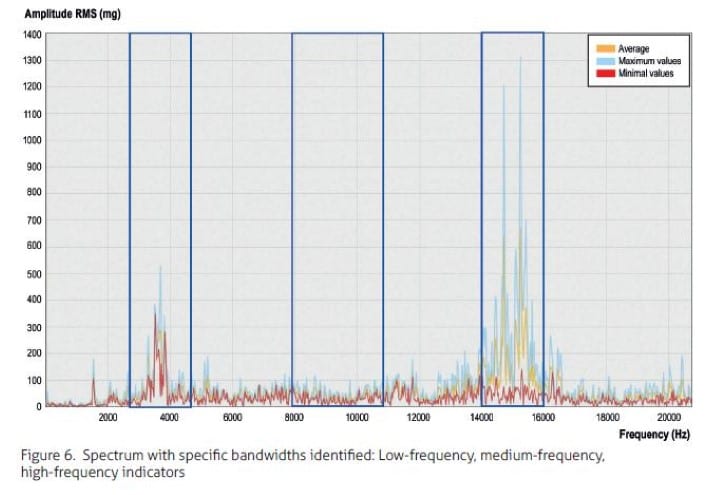
Next, in the vibration monitoring system, specific bandwidth vibration indicators have been created at the above frequencies, to better track these issues and then trigger suitable actions and procedures. A third indicator located at middle frequencies has been also set to alert in case of edge deposits. (Fig. 6)
By looking at the live diagram (Fig. 7), the high-frequency indicator was clearly way more reactive than total vibration. Thanks to this insight, coating hardness was identified as the main contributor of vibration and lead to an appropriate solution which gets global vibration down.
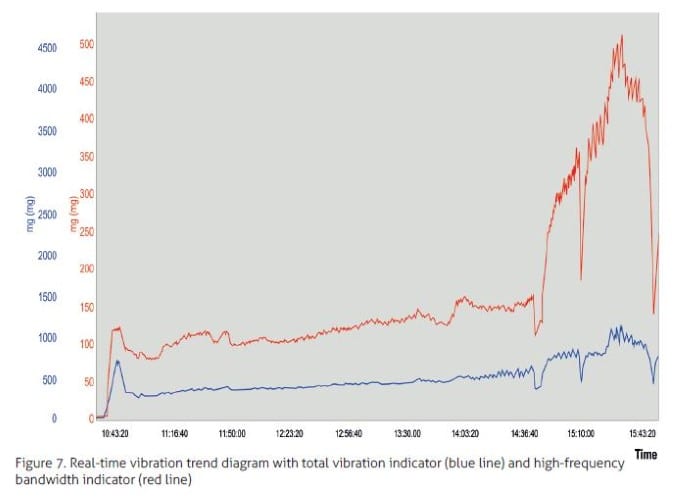
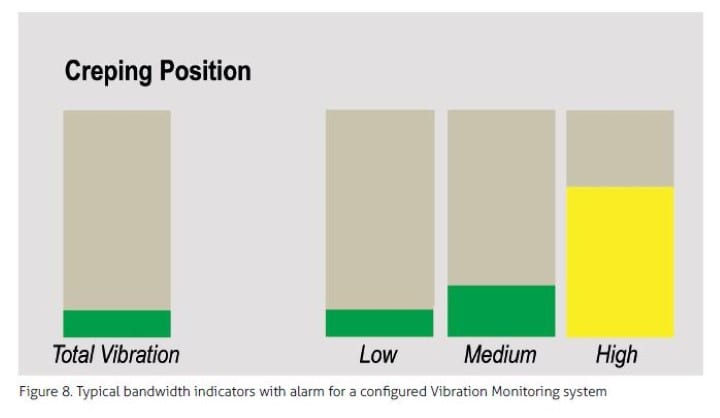
Due to its average calculation over the whole spectrum, a simple measure of total vibration would not have been able to isolate this critical factor on the machine so quickly. Finally, with the correct bandwidth indicators well established by this trial, alarms can be set on the operator’s interface to the vibration monitoring system. We prefer a simple ‘traffic light’ system (Fig. 8) where the alarms change from green, through yellow to red as the acceleration, and hence vibration energy, at the blade tip increases.
With this in place, the last part of the story is to train the operators in the remedial actions to take when an alarm is observed; typically a change of blade, coating adjustment, equipment check and so on through a series of escalating actions until the issue is resolved.
Conclusion
Doctor blade vibration monitoring is now becoming a standard in tissue manufacturing as the only reliable means to control, evaluate and anticipate dangerous vibration generated at Yankee doctors. Blade tip acceleration, expressed in RMS and PEAK, applied with the right bandwidth analysis of vibration signature is paramount to making it a useful diagnostic tool.
Discrete process phenomena events can then be related to specific vibration frequencies whose smart alarm levels are clearly displayed on the operator’s modern monitoring interface.
But monitoring and analysing vibration would be nothing without an efficient tissue machine diagnostic-based response plan helping the operators to trigger the right actions at right time, creating an essential and efficient corrective-action system.
Real financial benefits result, since costly Yankee coating and chatter problems can be avoided.
References
[1] P. Pagani, “Chatter Marks forecast and detection through the examination of the harmonic behaviour and evaluation of the friction coefficient”, Tissue World Conference Nice Acropolis 2011, March 28-31, 2011
[2] W. Von Drasek, W. D. Rand, S. Archer, G. Furman, “Crepe Blade Vibration Monitoring for Improved Efficiency and Asset Protection”, Tissue World Conference Americas 2012, March 20-23, 2012
[3] X. Escaler, O. De La Torre, E. Egusquiza, ”Analysis of chatter marks damage on the Yankee dryer surface of a tissue machine”, Engineering Failure Analysis. ISBN: 1350-6307, Vol.23, pp: 44-54, March 2012
[4] P. Pagani, A. Alessandrini, “Chatter Marks: Origin, Evolution and Influence of the Creping Doctor”, Tissue World Conference Nice Acropolis 2003, March 24-27, 2003
[5] Endevco, 2014, “Steps to selecting the right accelerometers”, URL: https://www.endevco.com/news/newsletters/2012_07/tp327.pdf
[6] Meggit Sensing Systems, 2014, “Sensor overloading”, URL: http://www.wilcoxon.com/knowdesk/Sensor%20overloading%20tech%20tip.pdf


