


By Fisher International’s Bill Burns
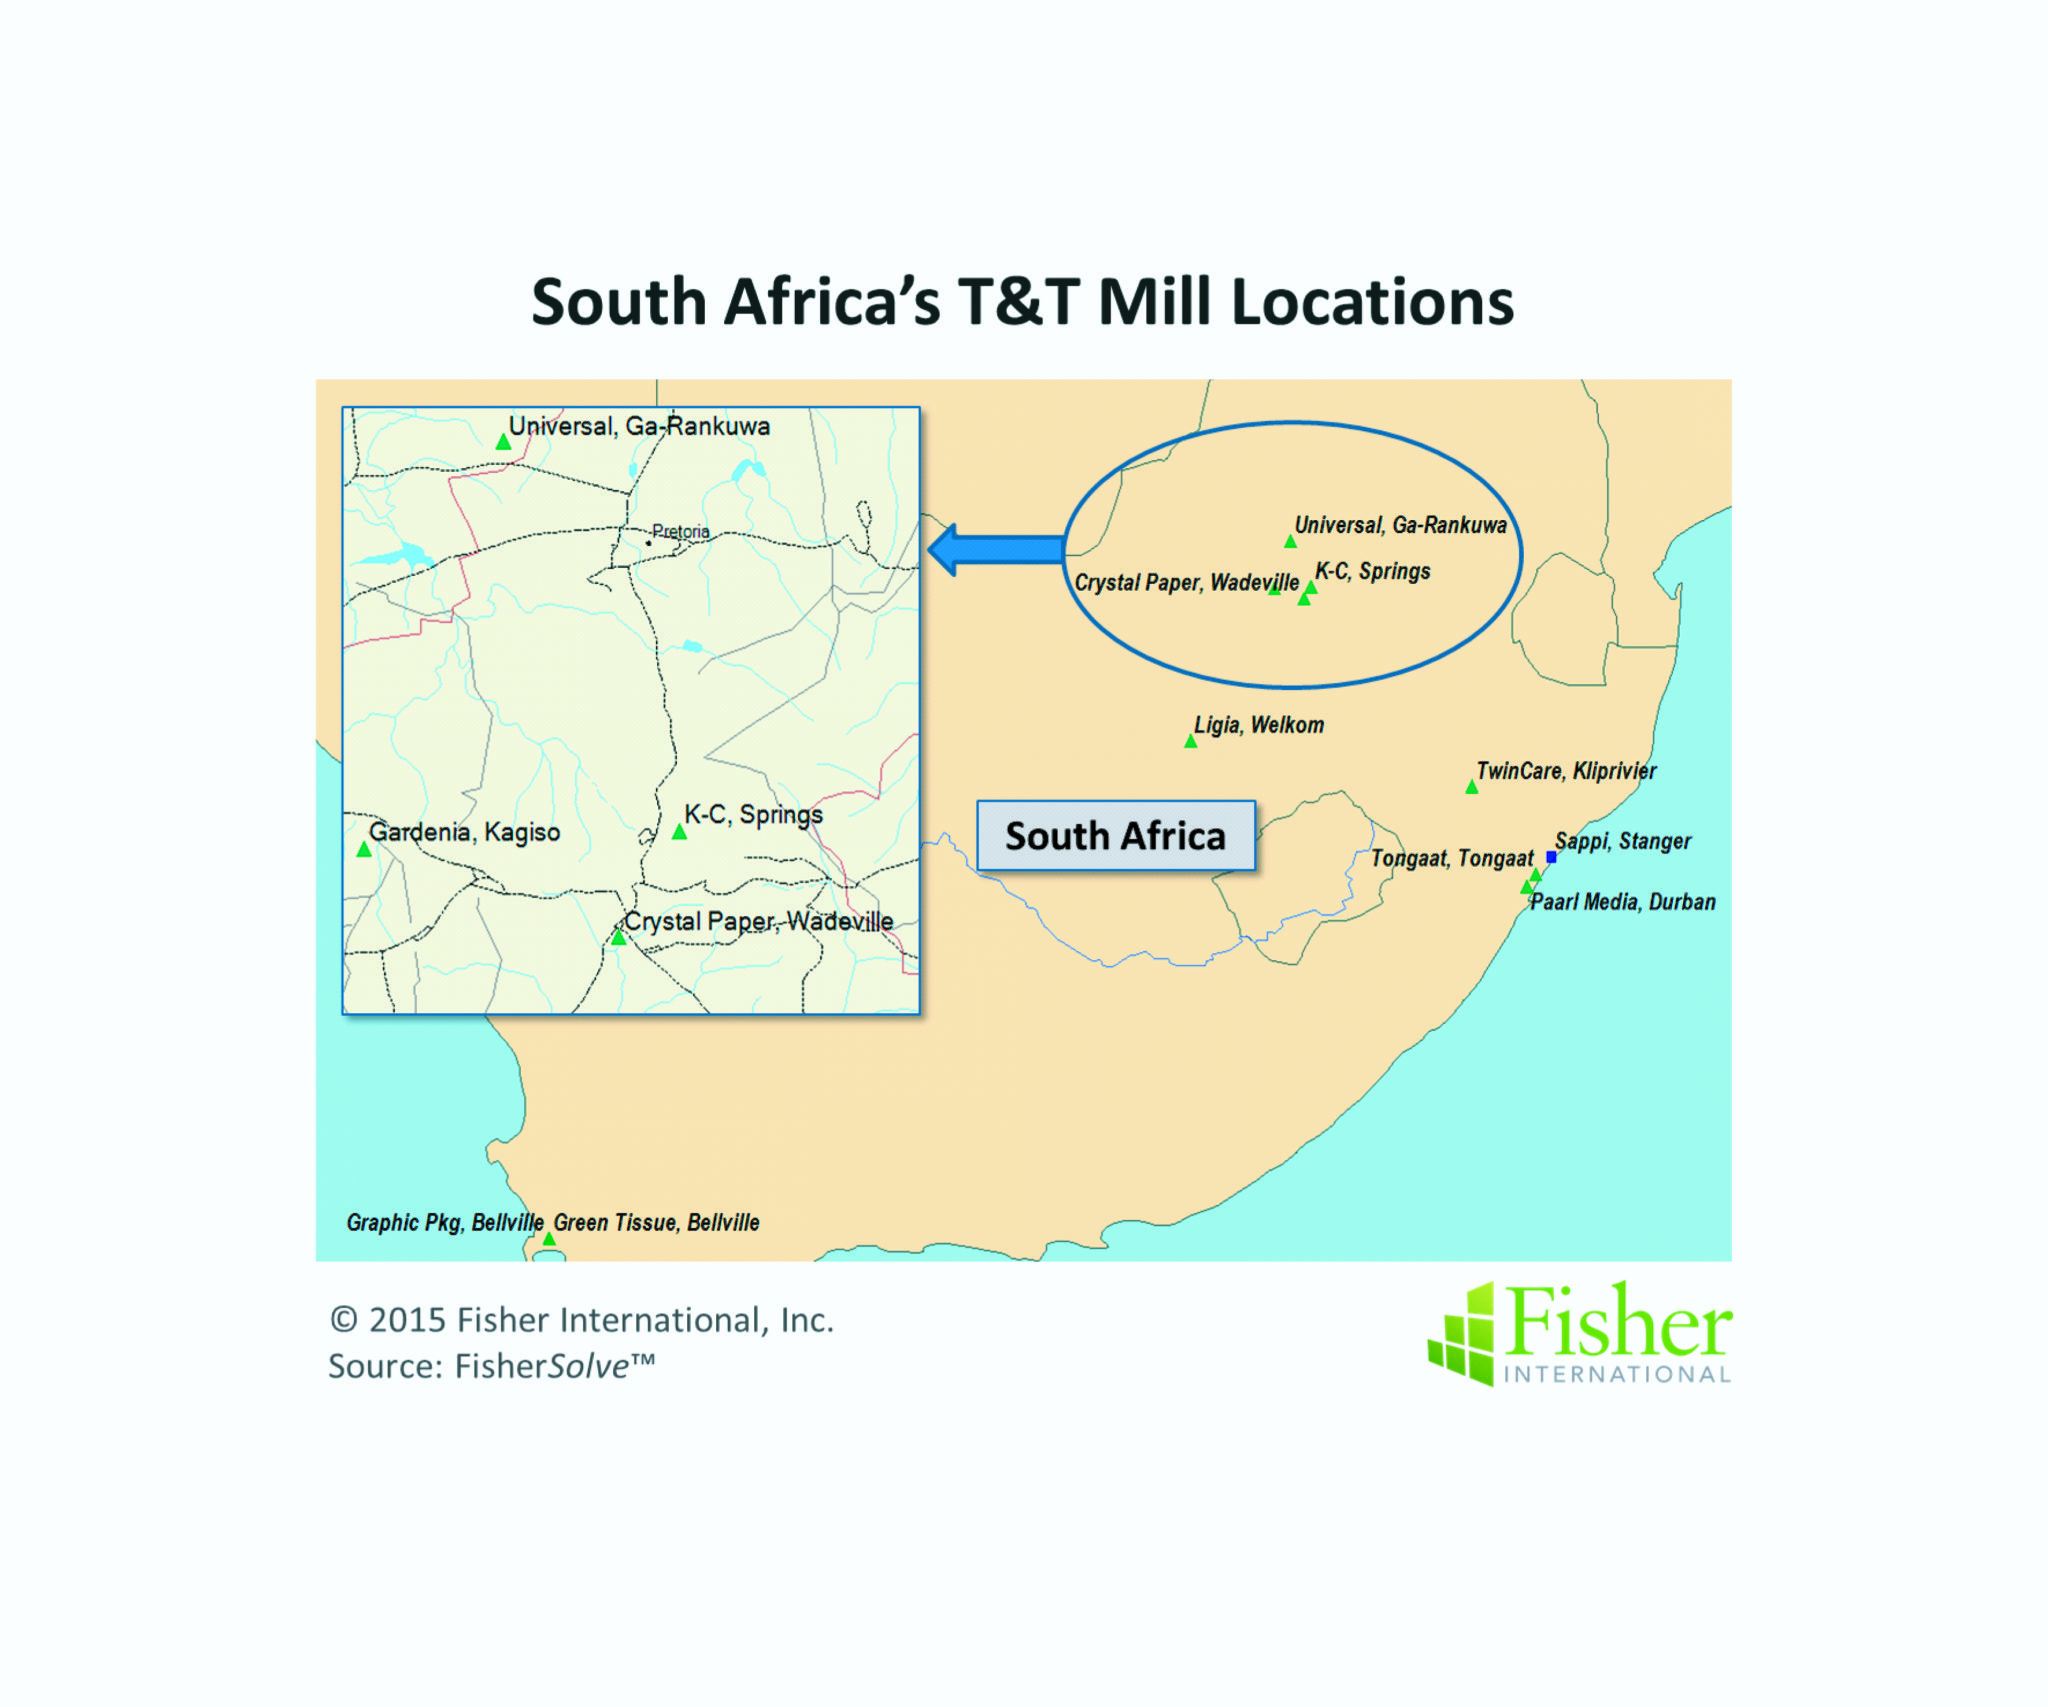

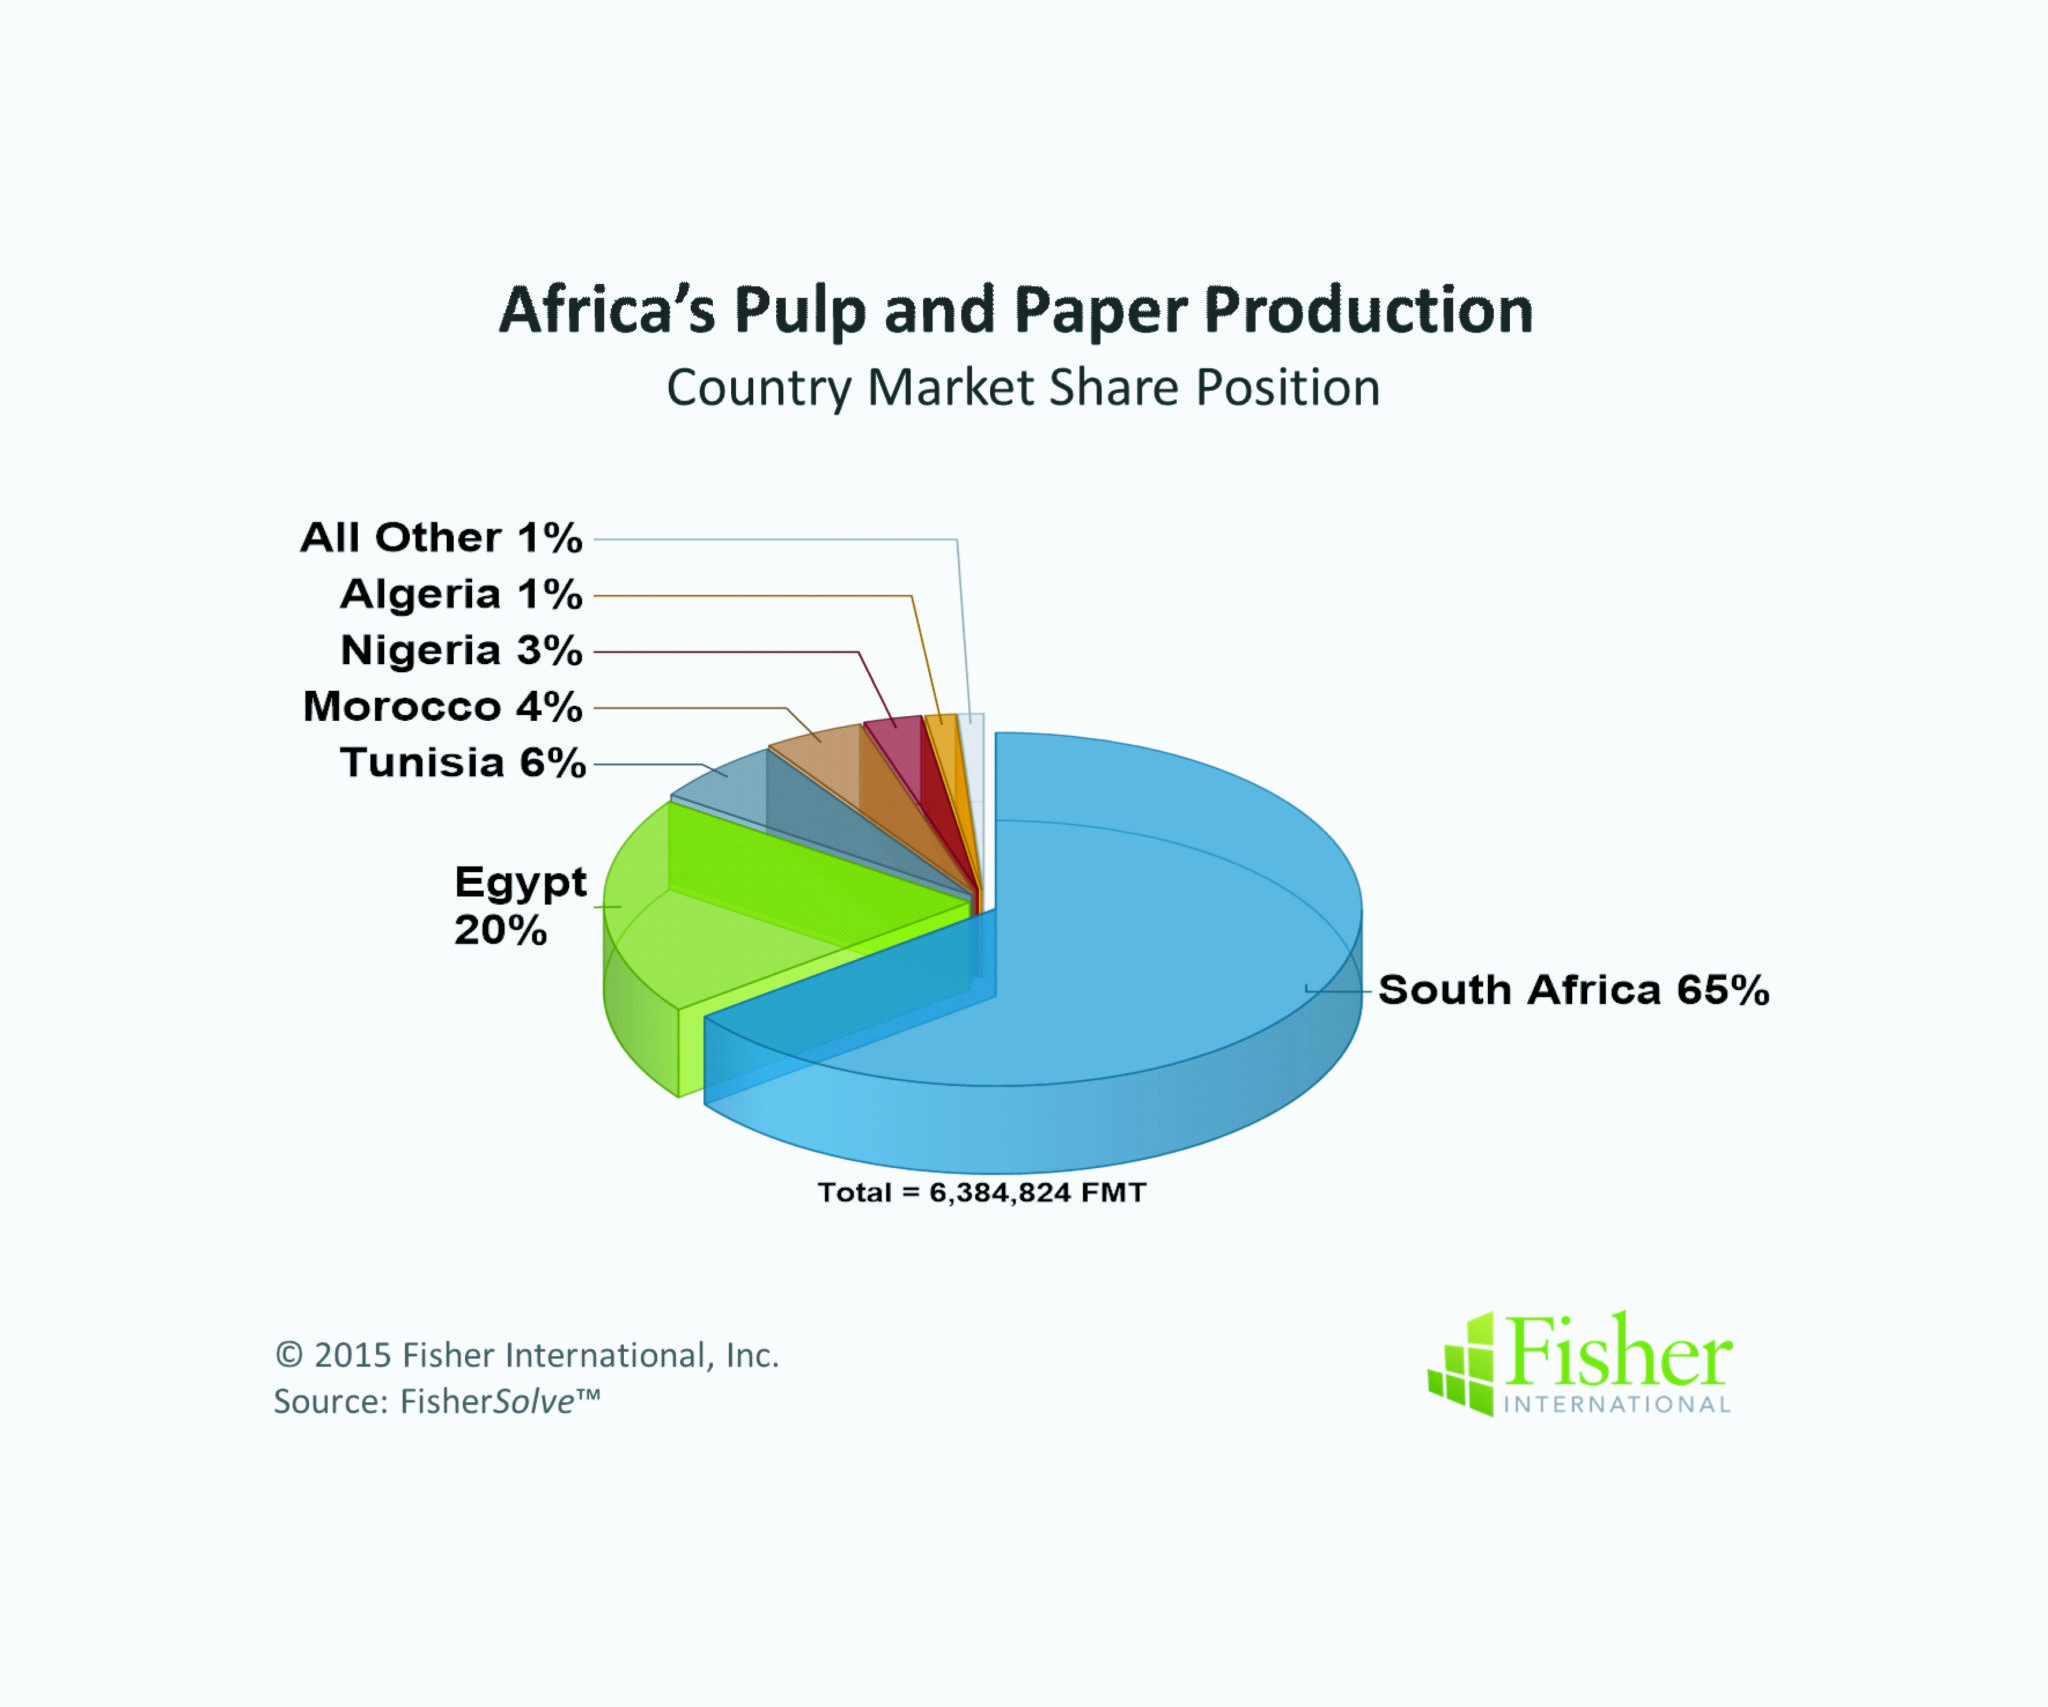

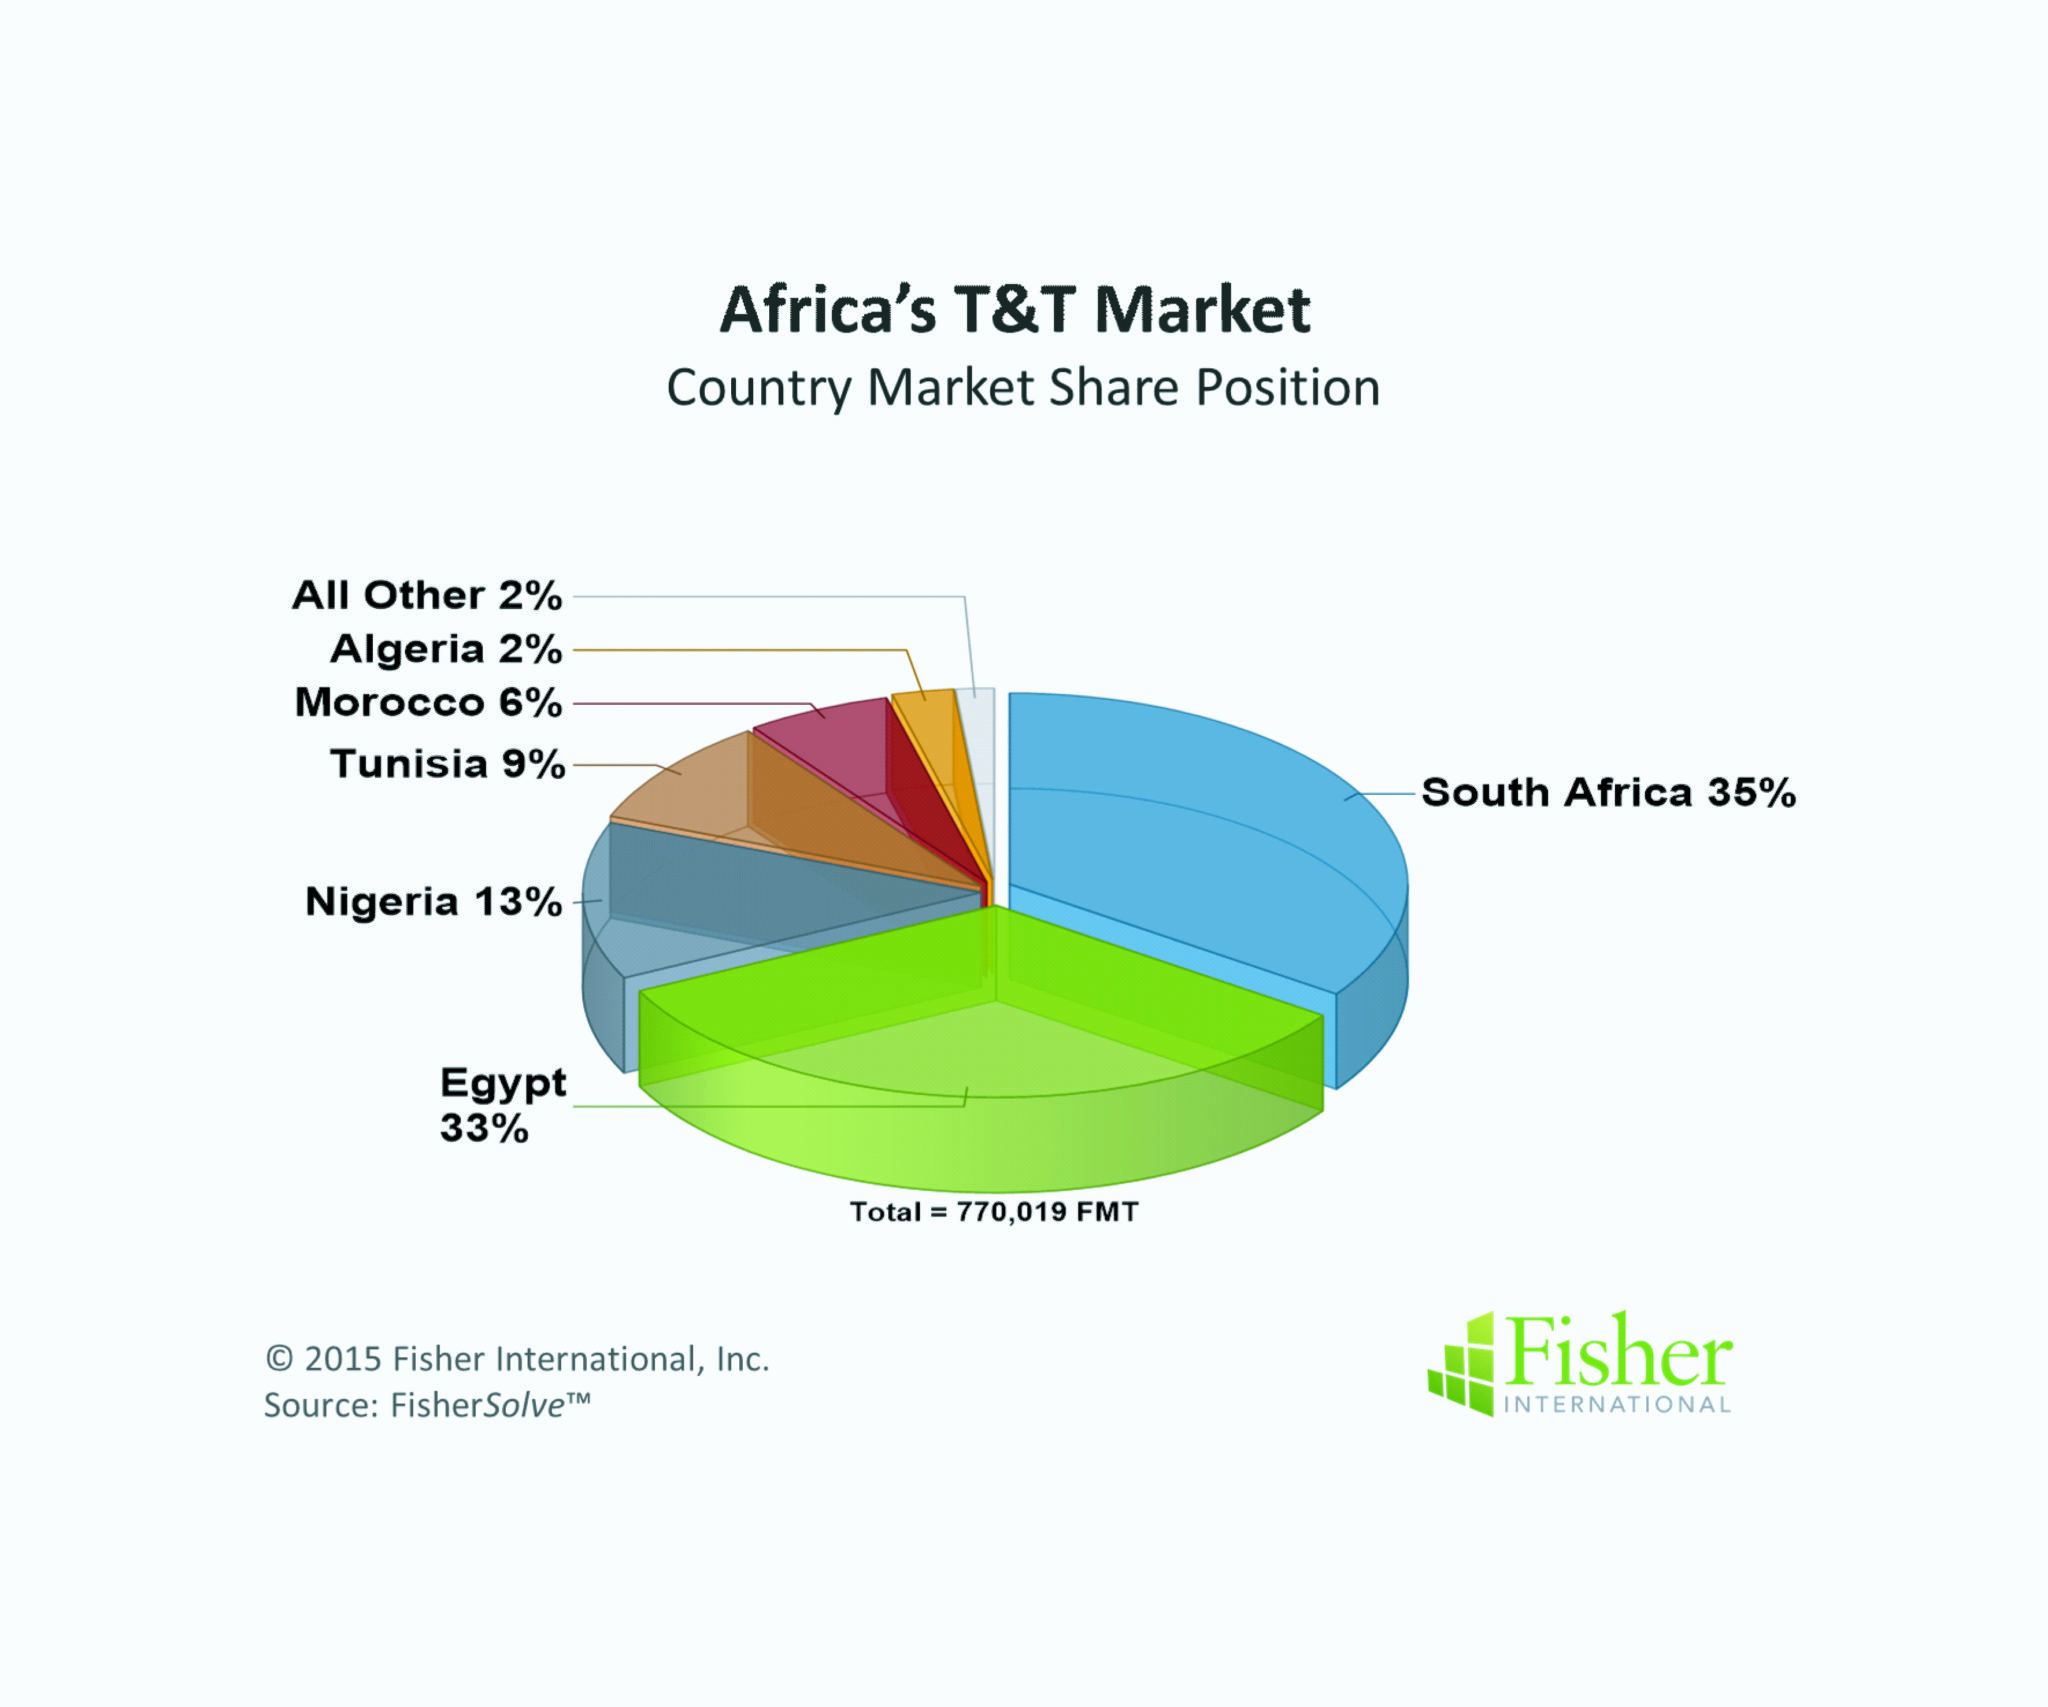

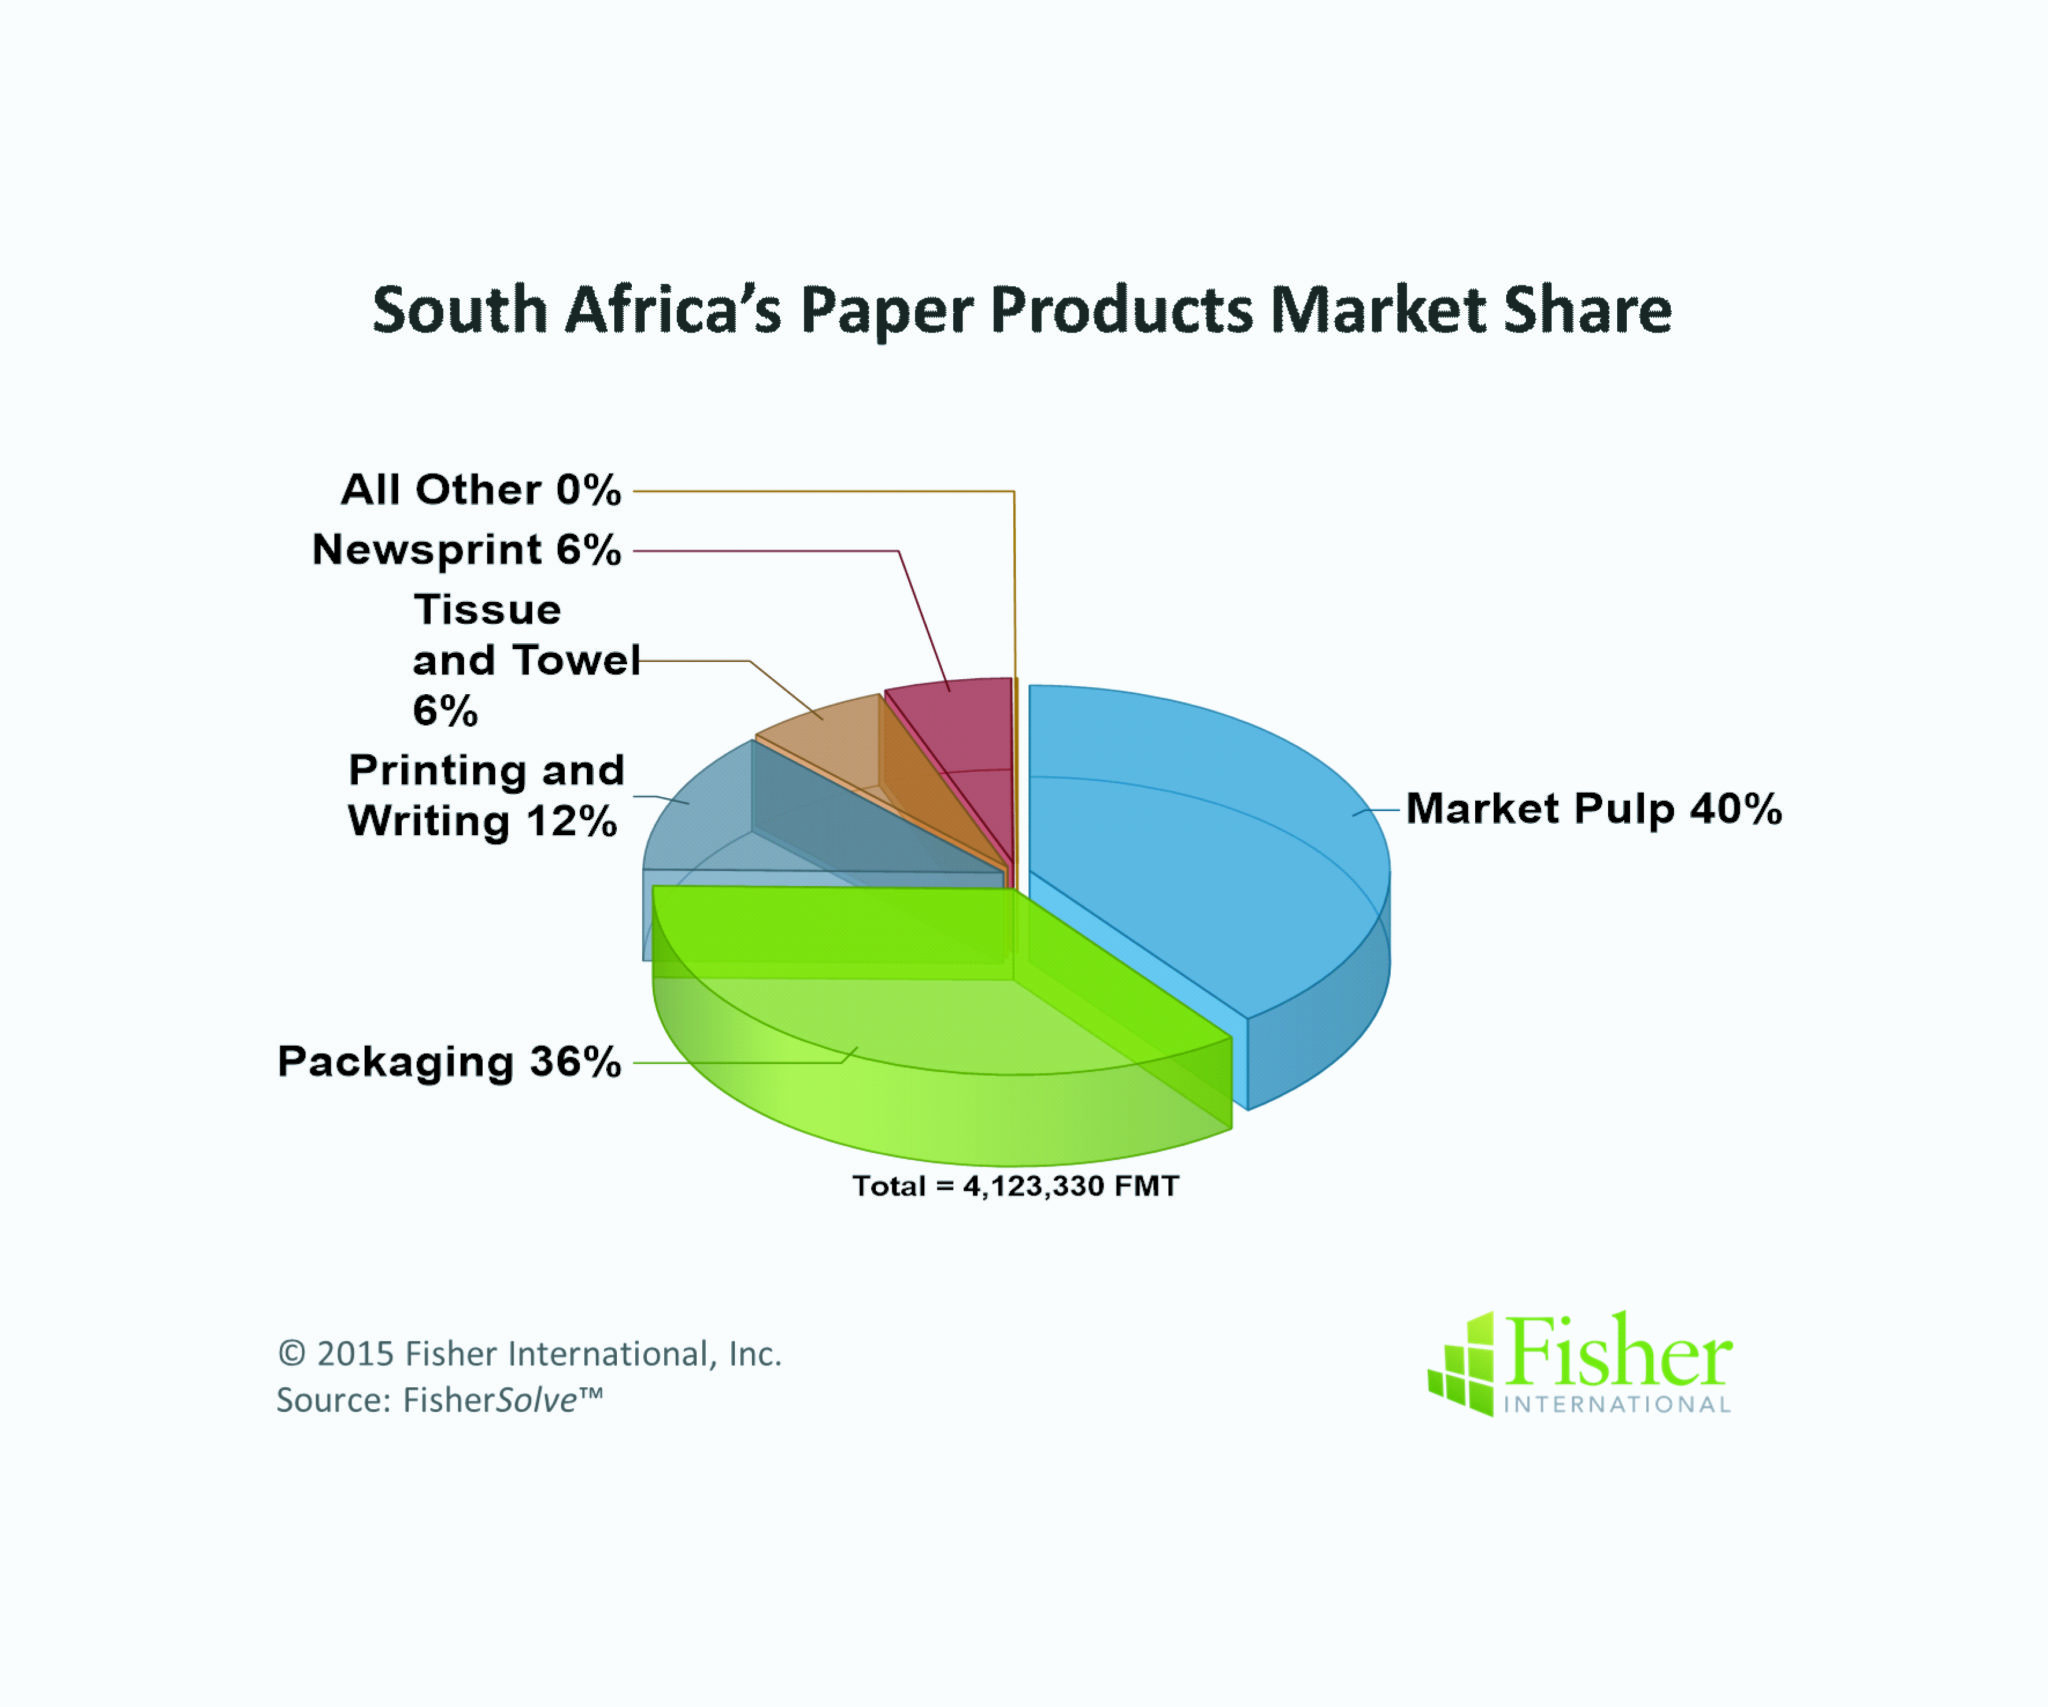


Globally, Africa (Sub-Sahara and North Africa combined) is not a significant producer of Pulp and Paper (P&P) products. The region is fifth out of six (just ahead of the Middle East) in total P&P production and sixth out of six in Towel and Tissue (T&T) production. (Fisher can roll up data by six global regions defined as: Africa, Asia, Europe, Latin America Middle East and North America.) With a population in excess of 1 billion people and growing, Africa is second only to Asia with 4.3 billion in market potential. Within Africa, P&P production is concentrated in two areas, South Africa and Egypt, with South Africa holding the highest share at 65% (Figure 1). T&T capacity is also distributed between these two significant producing countries (Figure 2). Within South Africa, the distribution of grades is heavy on Market Pulp and Packaging while Printing and Writing, T&T, and Newsprint are each less than 15% of production (Figure 3).
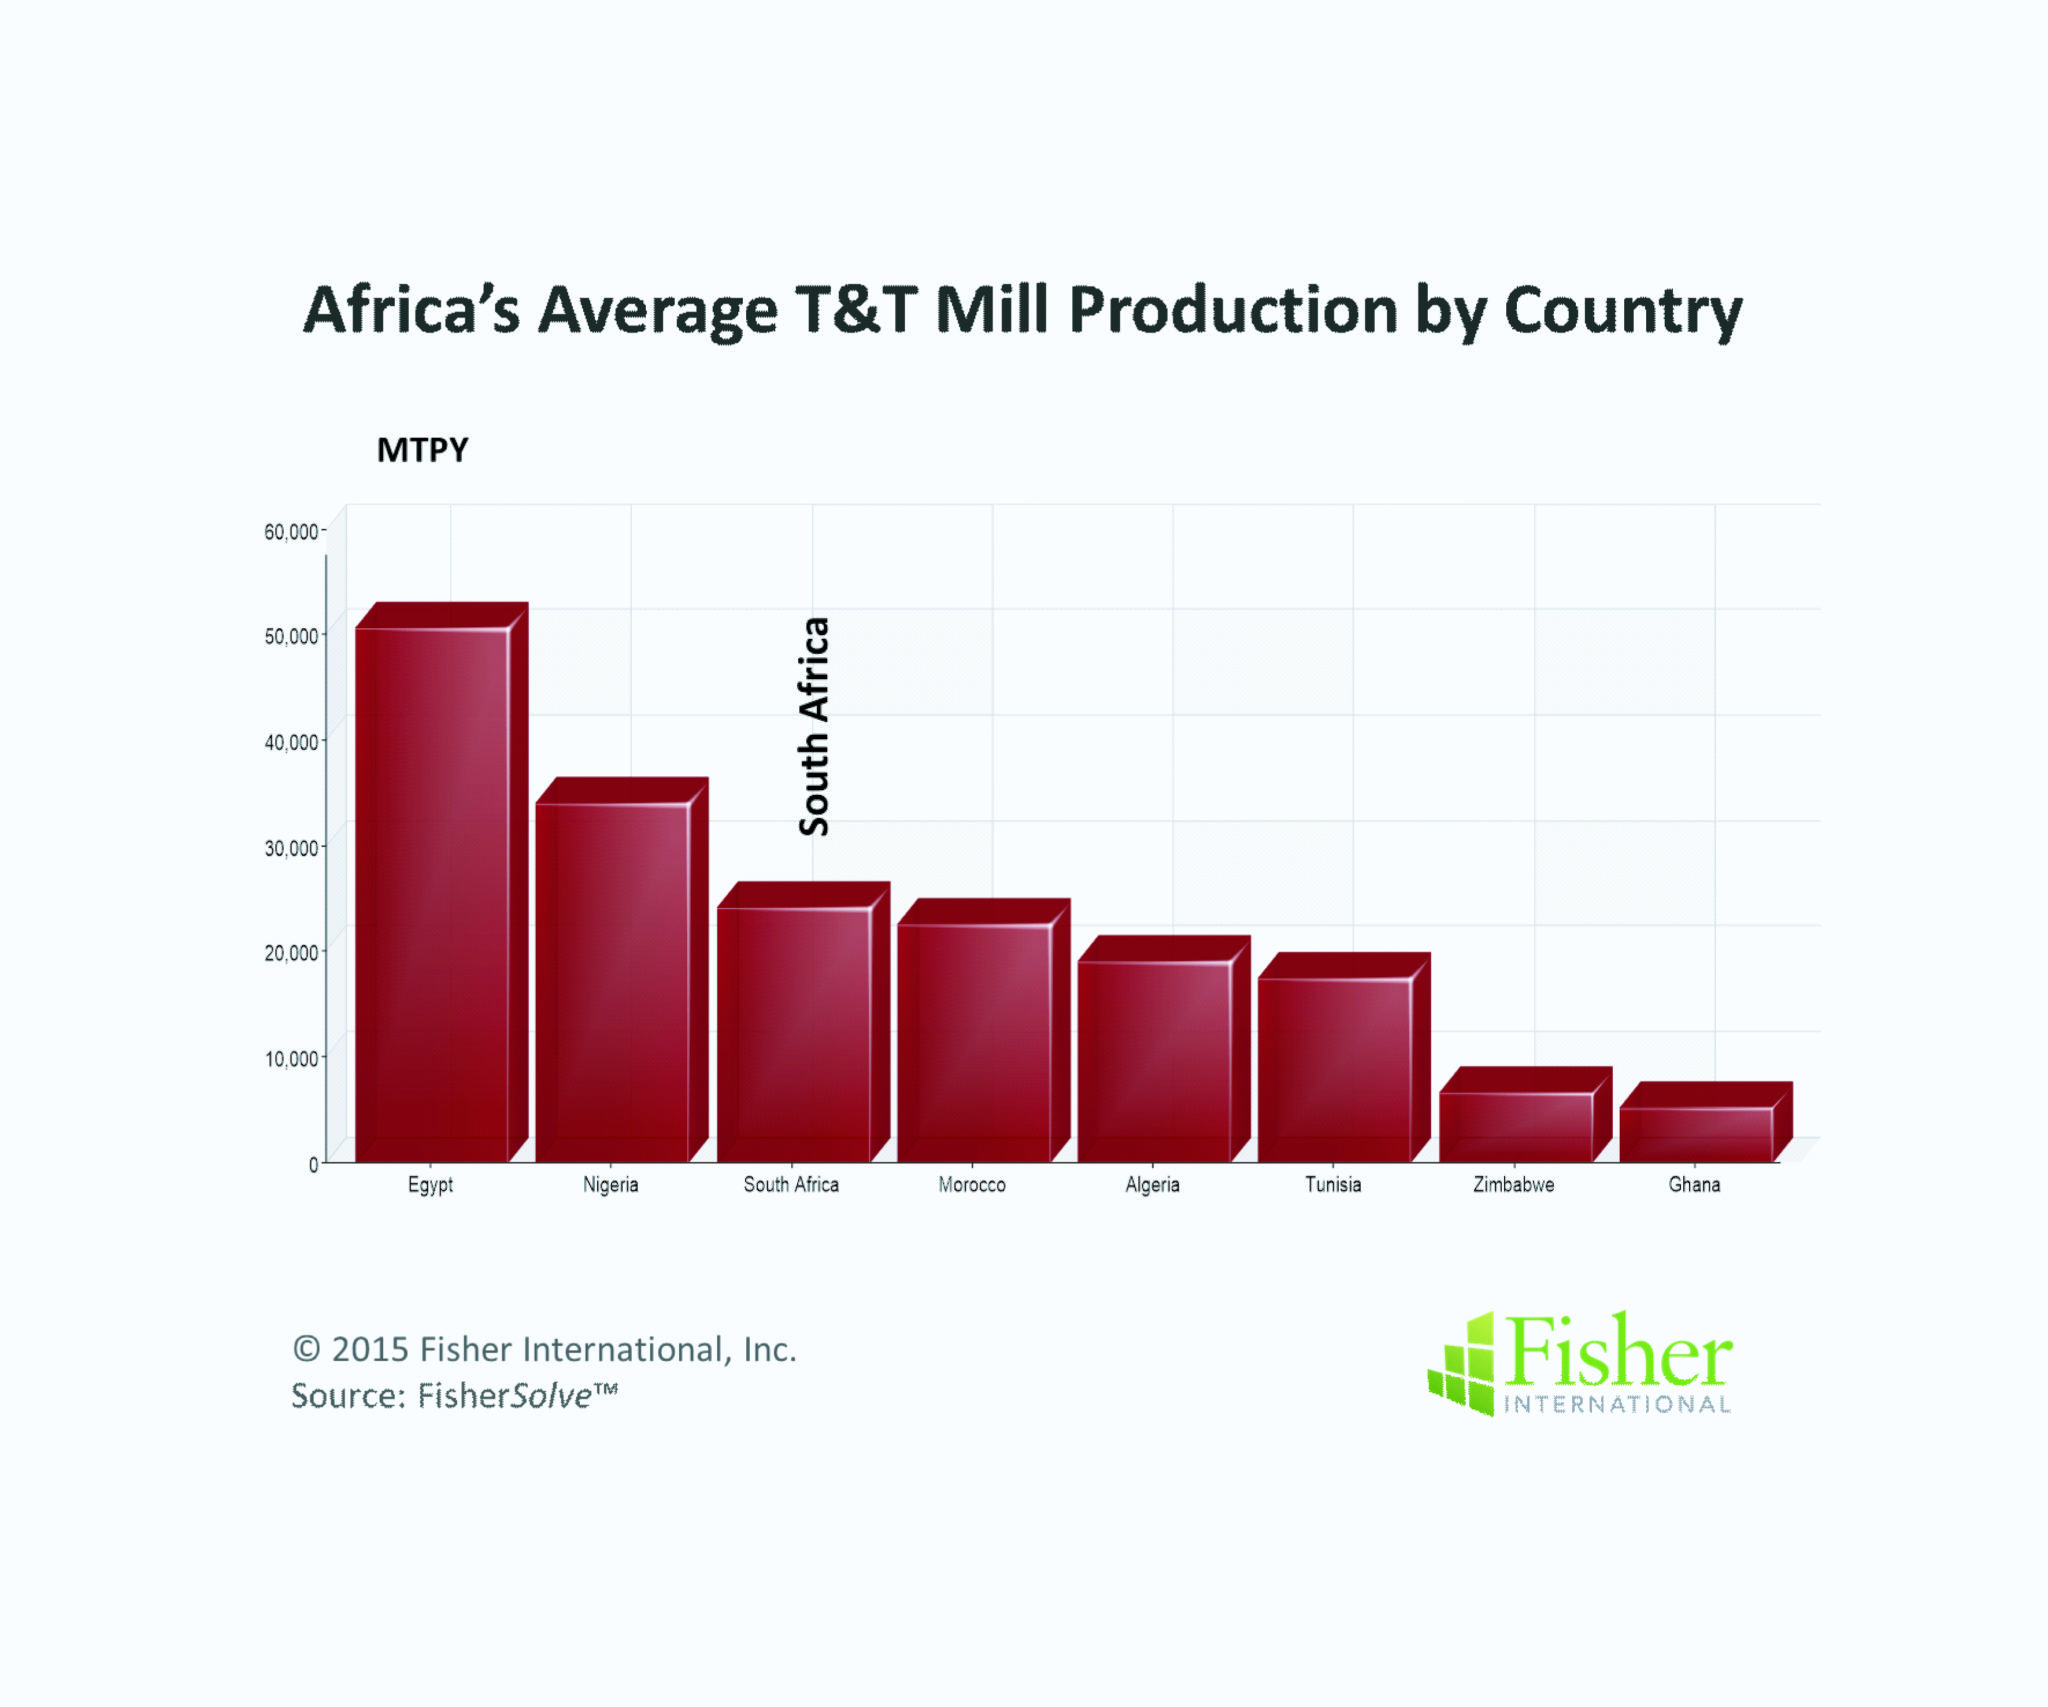
Broadening the country T&T comparison a little further, it is interesting to note that mill capacities are relatively small throughout the continent. Egypt averages higher than the remaining countries in Africa with approximately 50,000 MTPY which is low compared to other parts of the world. On the continent, South Africa is 3rd with a very modest average mill capacity rate of about 25,000 MTPY (Figure 4).
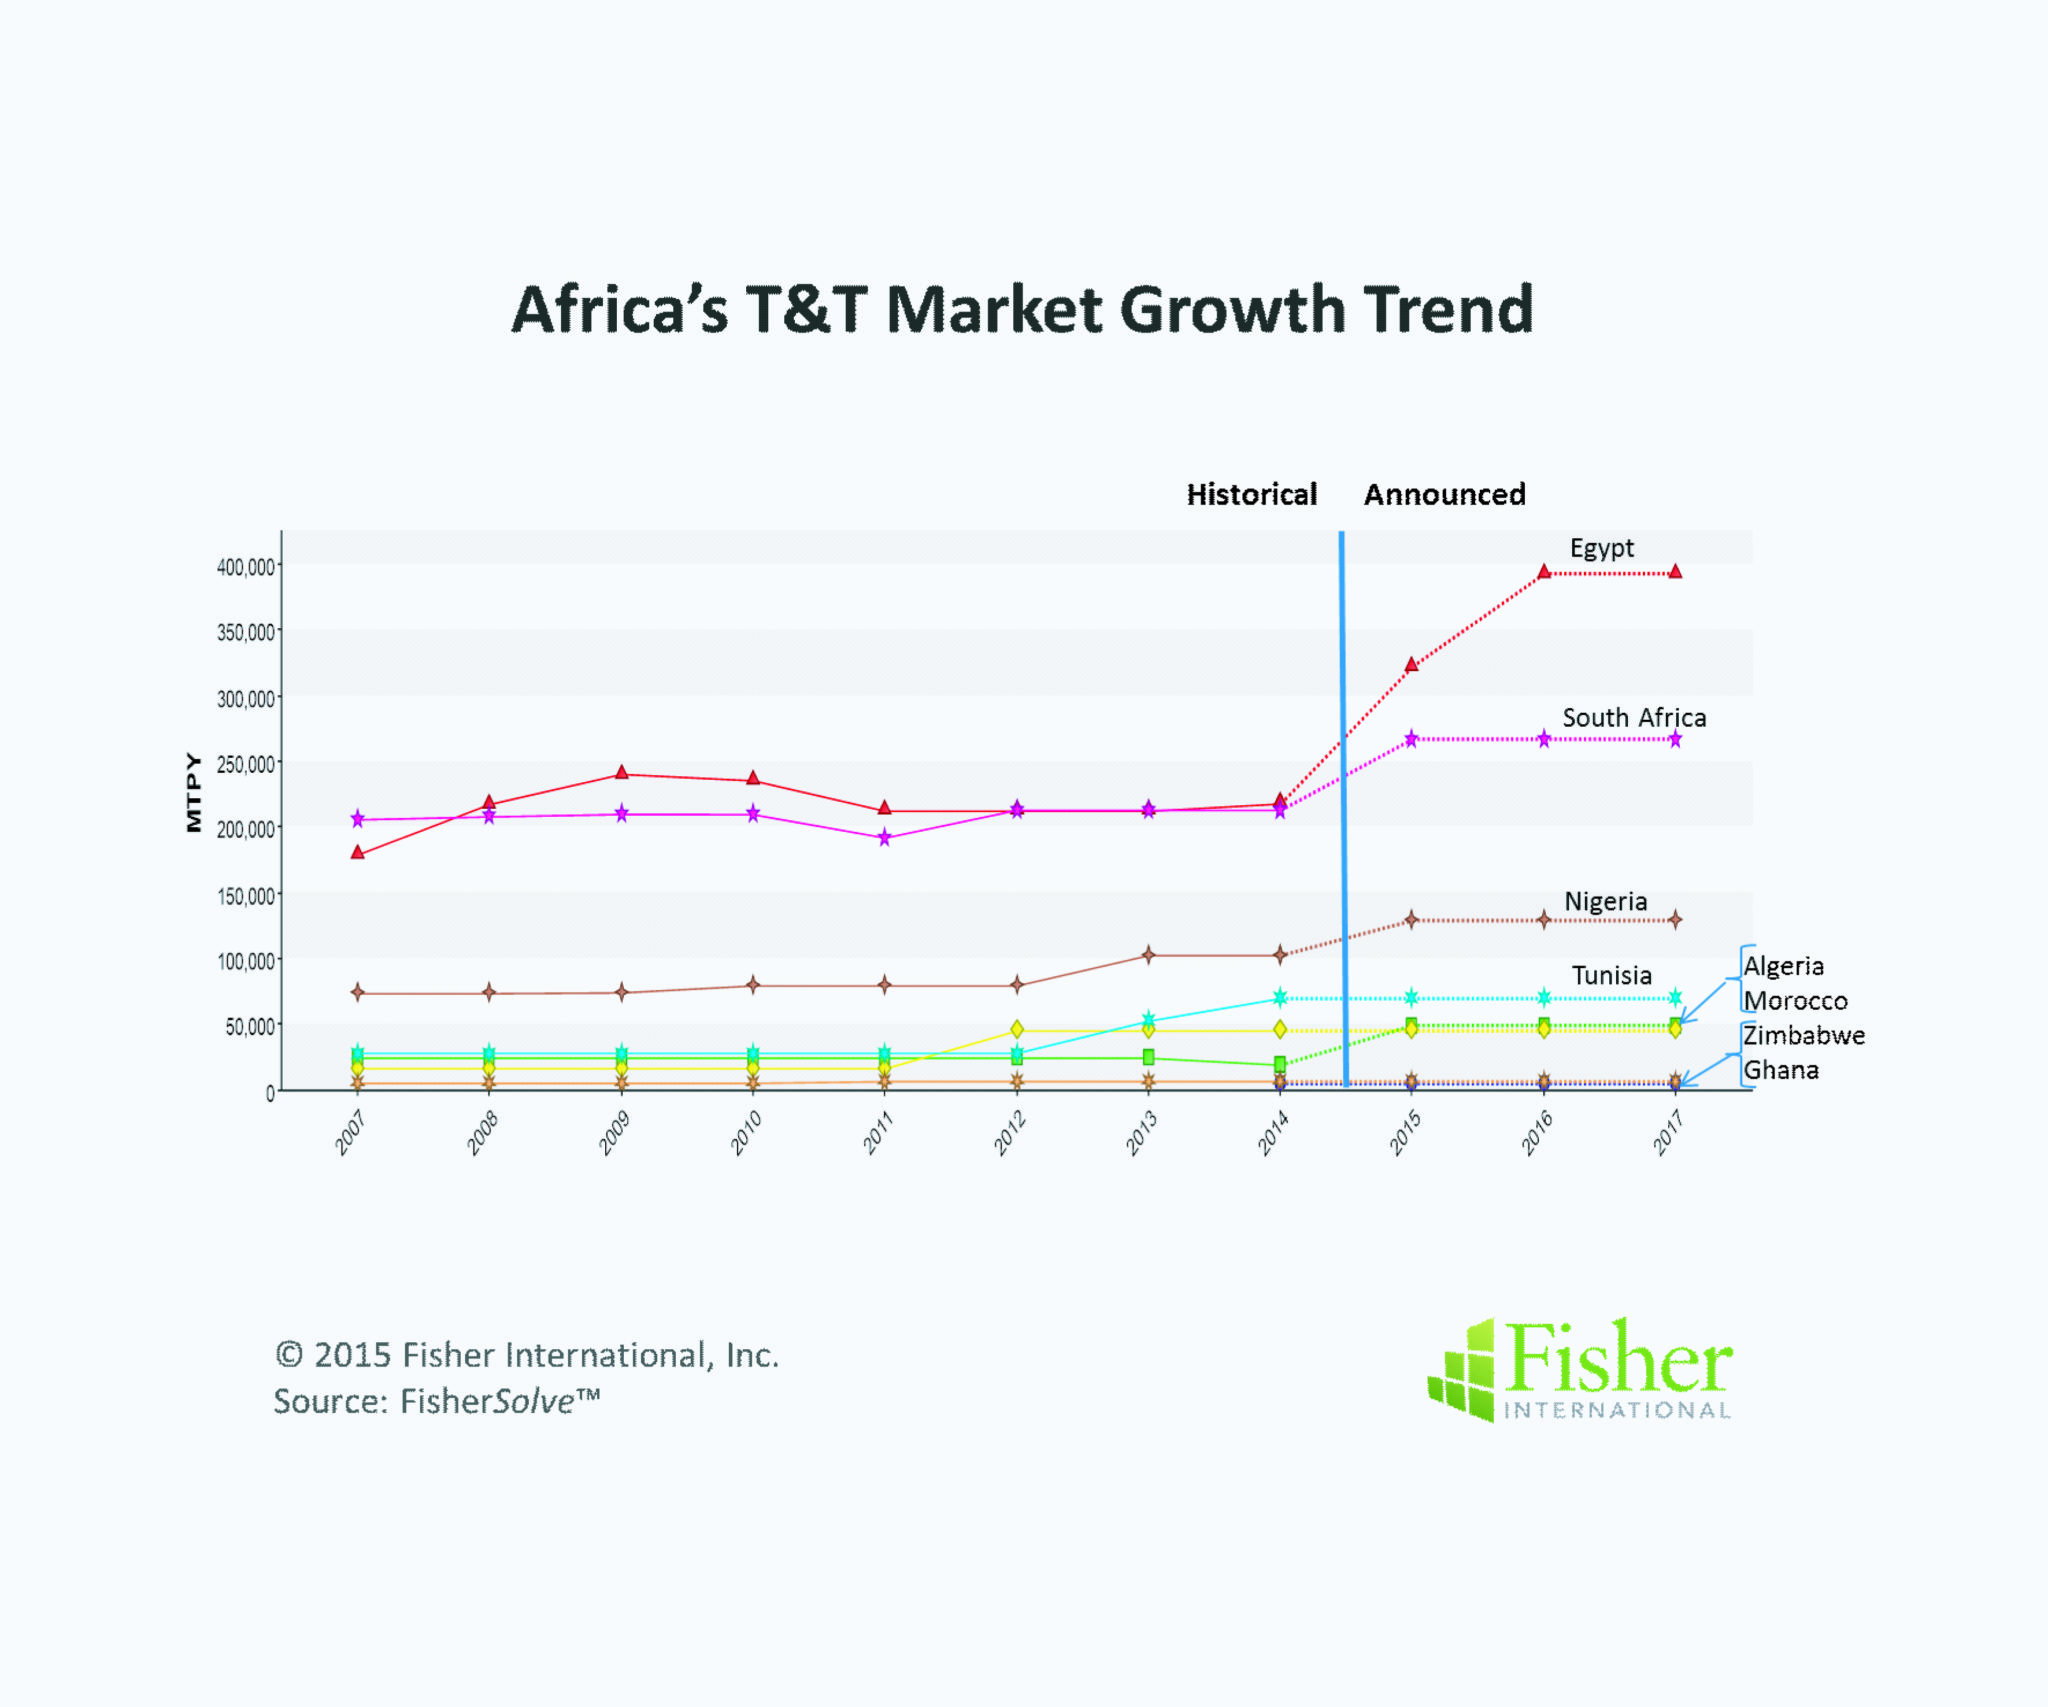
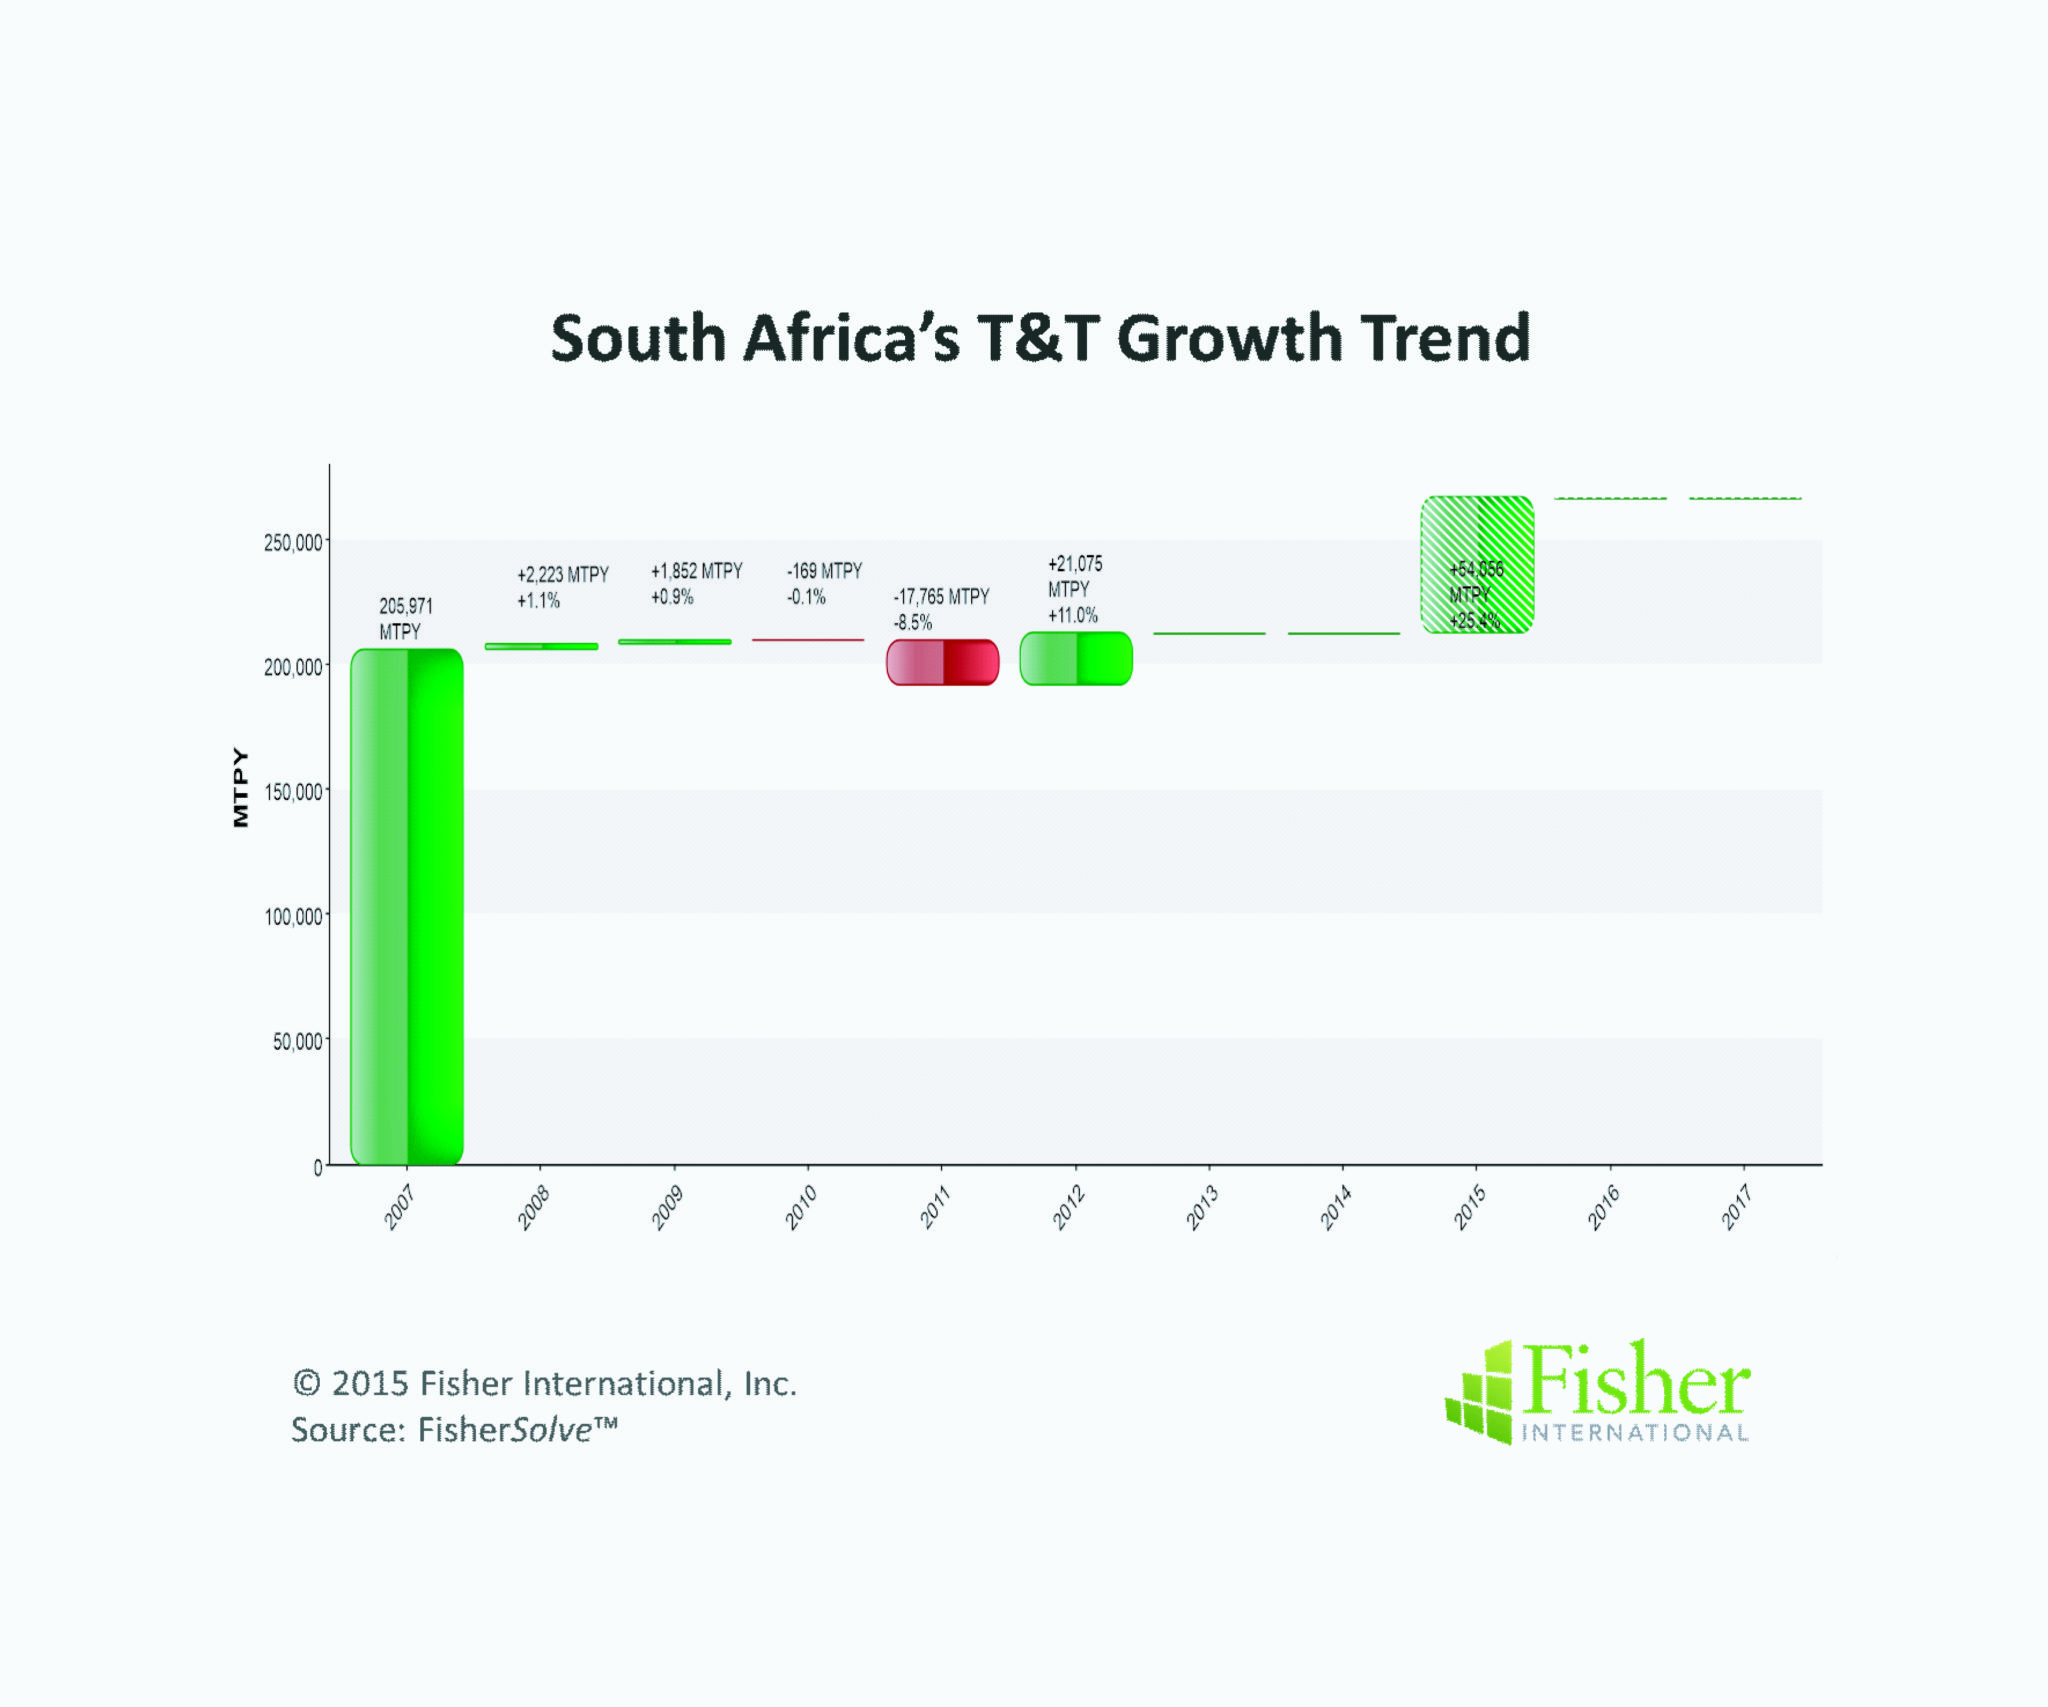
Tracking capacity trends in recent history is an important task for understanding T&T production in Africa. The relationship between large populations and low production numbers in today’s global economic environment might lead you to expect a growing market with positive forecasts and announced projects. That is not the case in Africa where there has been very low growth over the last 7 years and very little growth is projected going by current announced changes (Figure 5). Concentrating just on South Africa, the trend line shows both ups and downs over the same 7-year period. More recently, two mills shed some tonnes in 2011 and one new mill came on line in 2012 resulting in a lack of perceivable growth or shrinkage (Figure 6). There are some announced capacity increases for 2015 which, if materialized, would add approximately 25% capacity to the country. While 25% sounds like a major change, the area is still underdeveloped from a T&T product saturation standpoint.
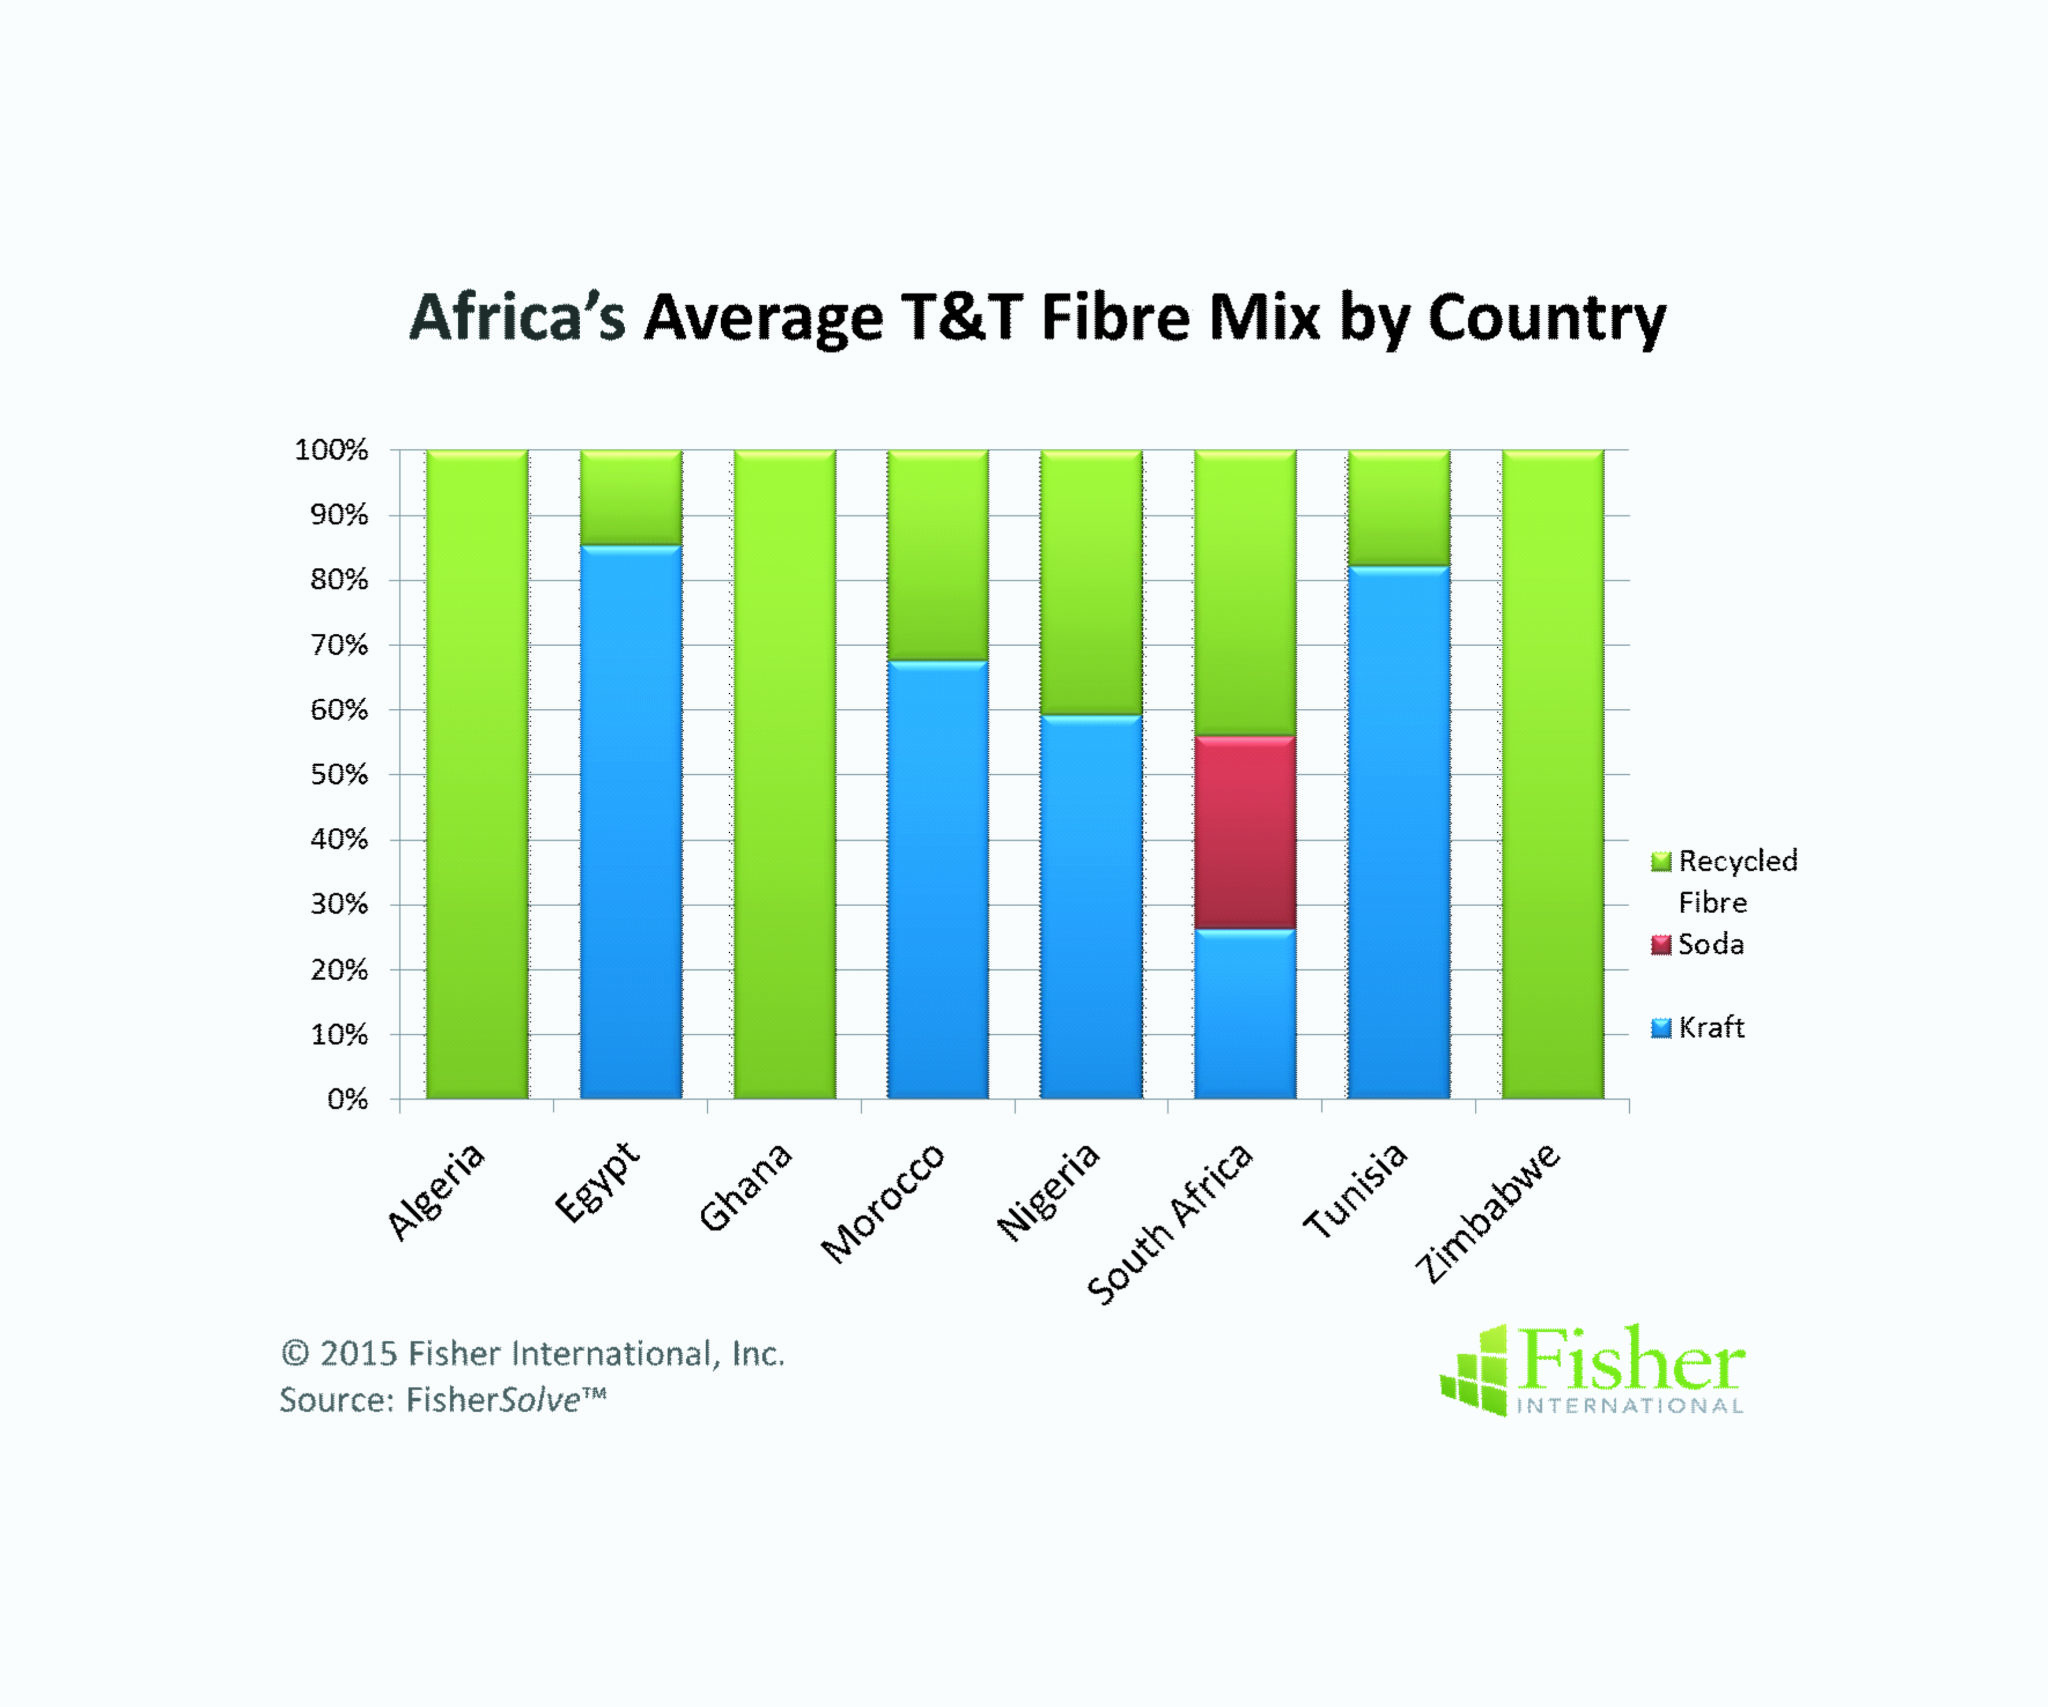
Fibre sources and machine specifications are the two most commonly considered issues for understanding T&T production. Fibre mix in Africa’s T&T production represents a diverse set of strategies from all Recycled fibre to various combinations of Kraft and Recycled (Figure 7). In South Africa, a combination of Kraft, Soda and Recycled fibre is profiled.
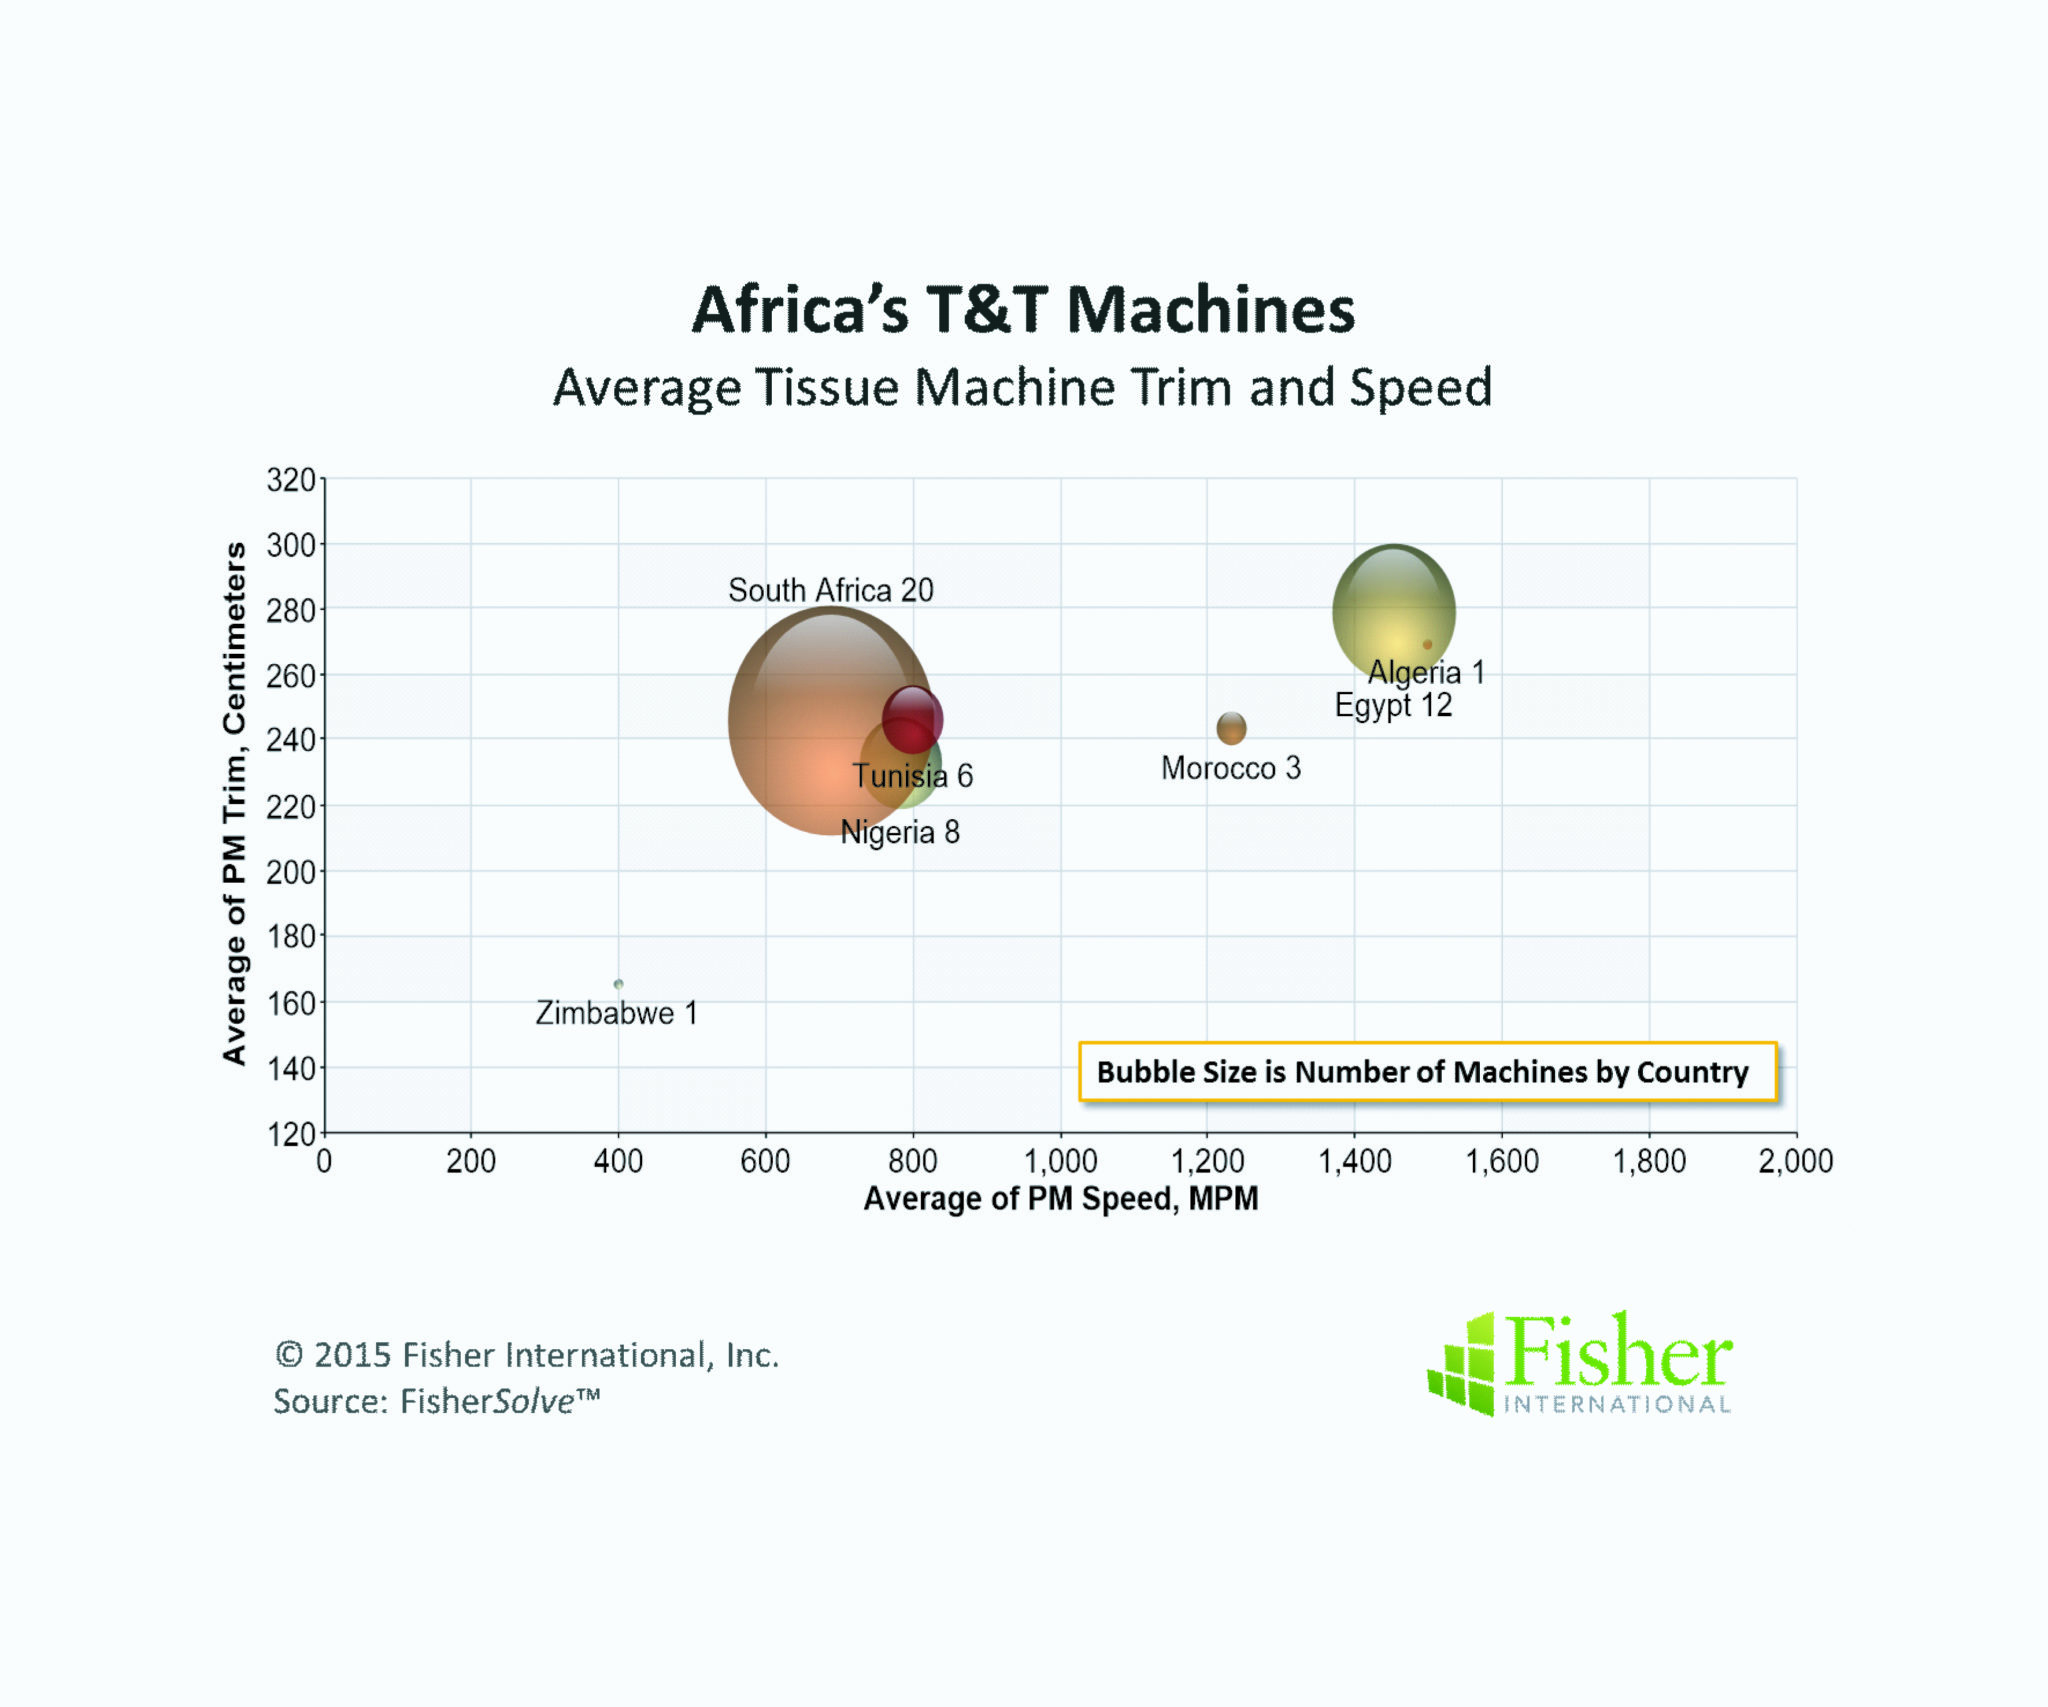
Machine speeds and trims are equally significant indicators in assessing the competitive position of T&T production. In Africa the machines tend to be uniformly narrow (2.5 metre) in trim. Speeds, on the other hand, range from slow (400 mpm) to moderate (1500 mpm). South Africa’s machines average on the lower end in both categories (Figure 8).
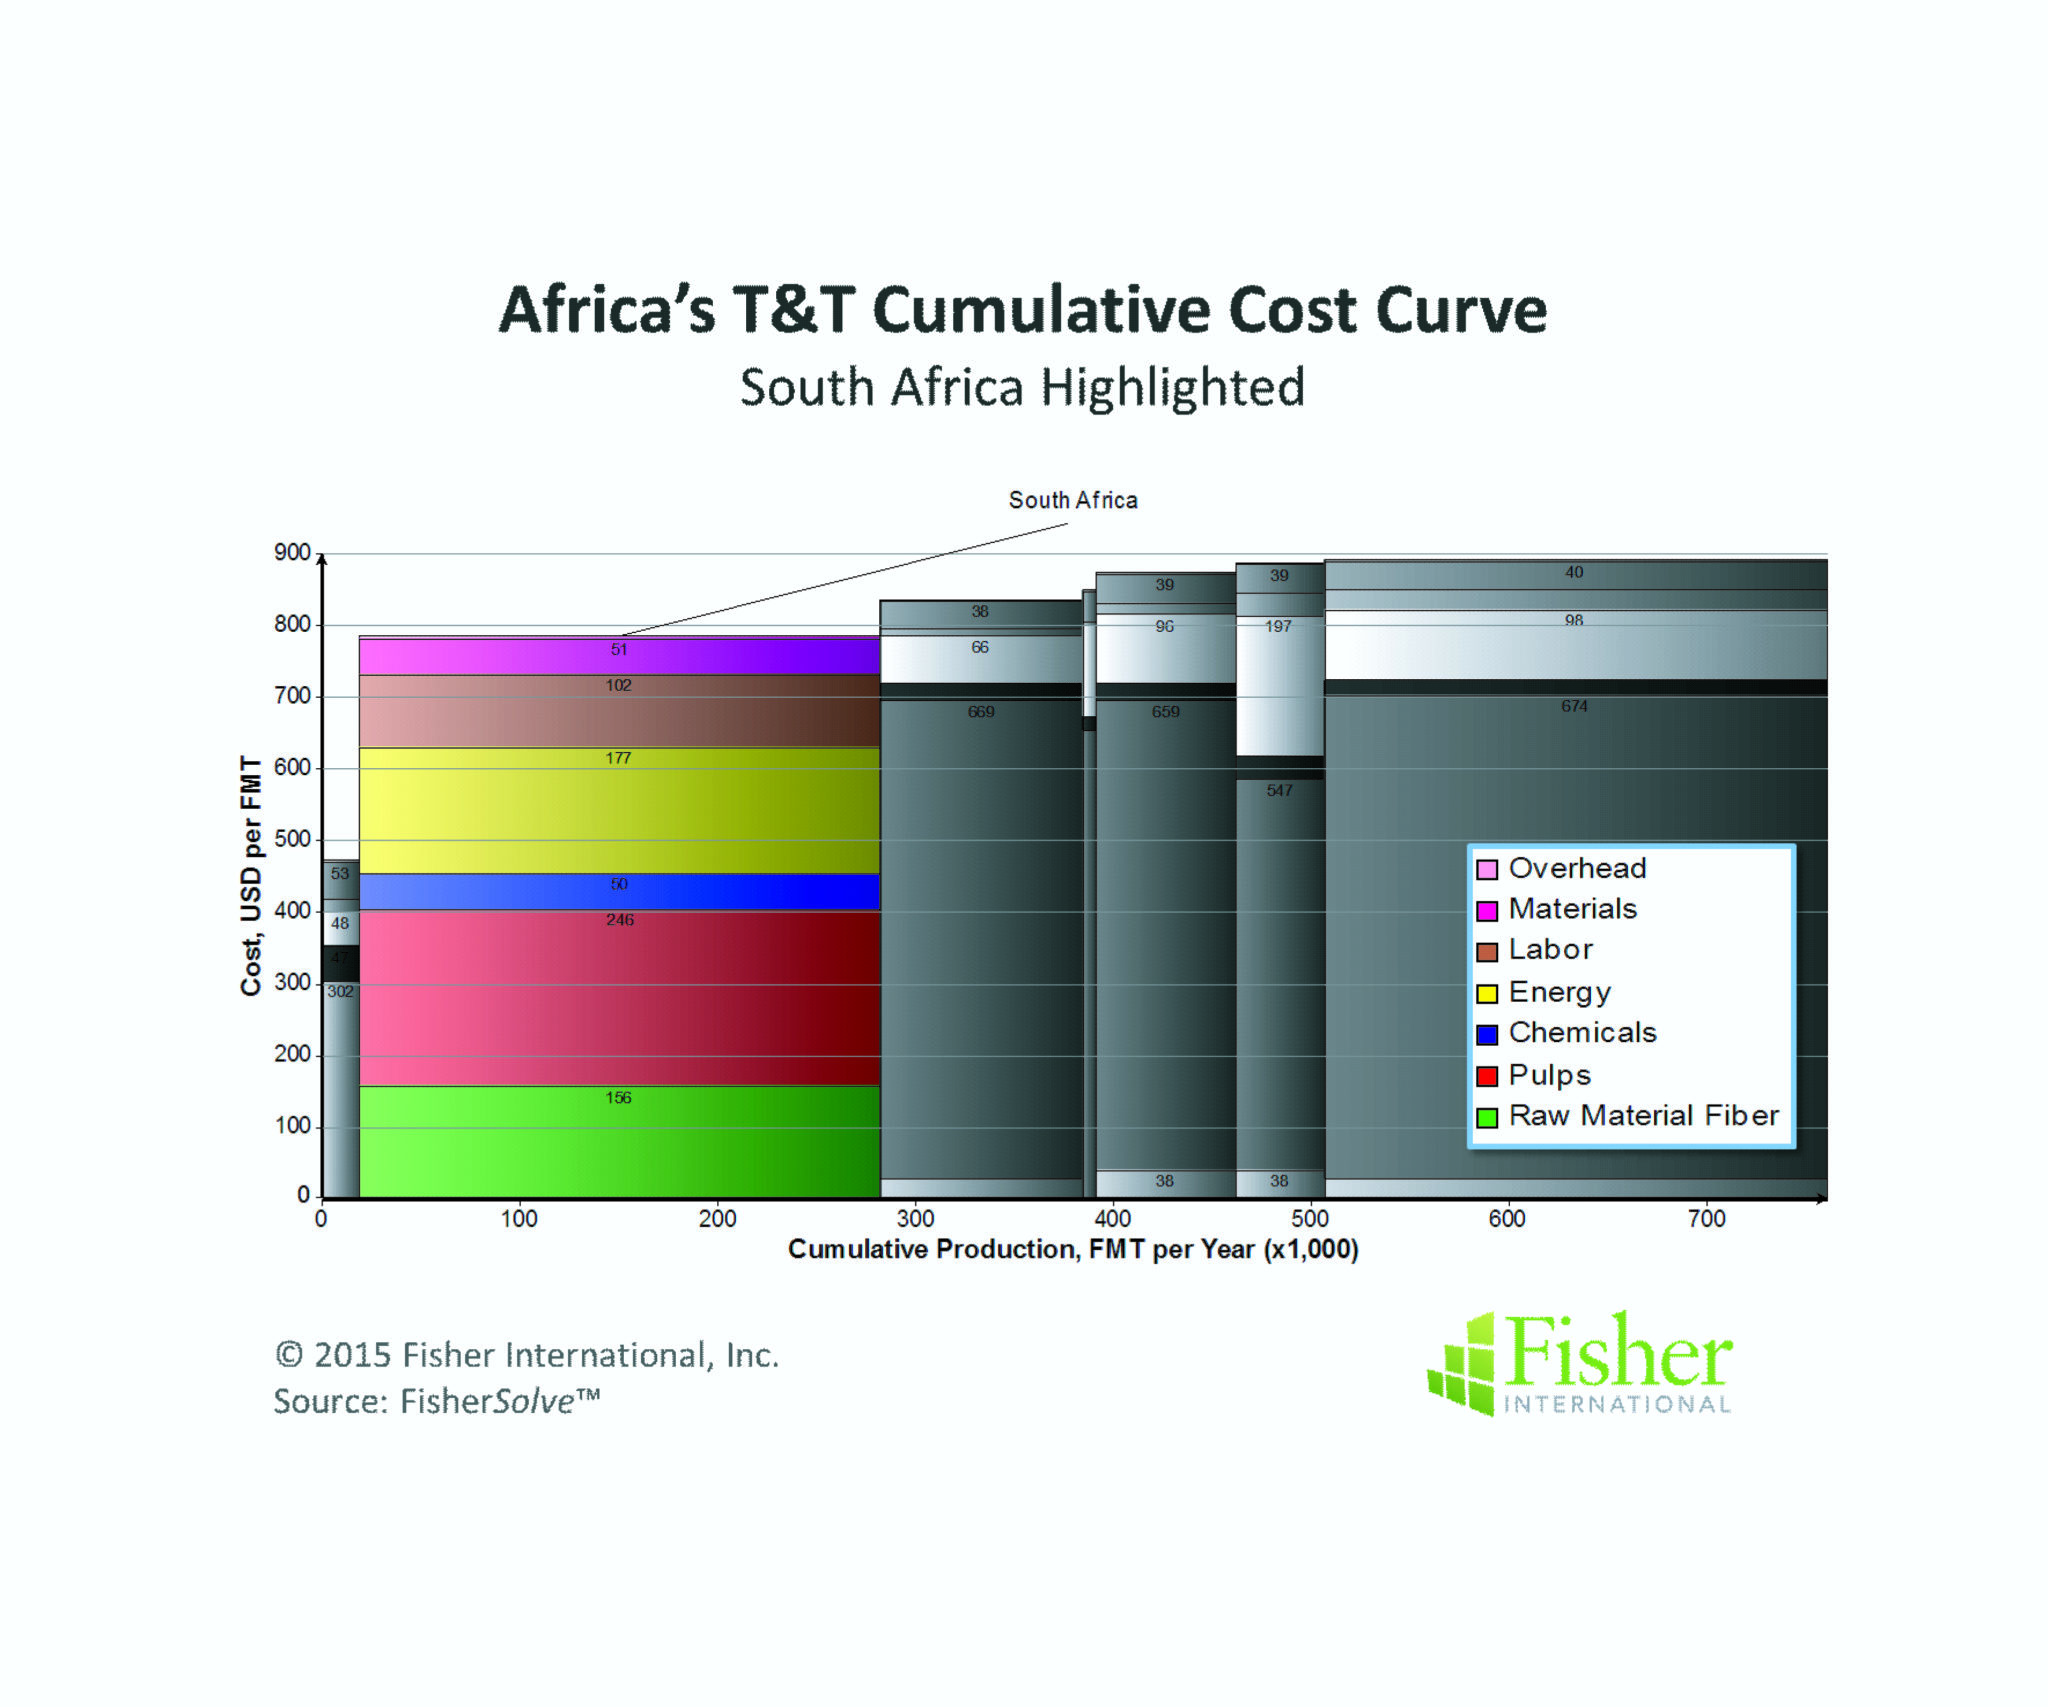
To the extent that African countries can be ranked competitively against peers – given the gulf in GDP across the continent and among the T&T producers (Zimbabwe’s annual GDP is $20 billion while Nigeria’s is $568 billion with South Africa falling in between at $352 billion) – South Africa holds a very competitive cost position. Its mills, on average, represent the second lowest cost position in Africa (Figure 9). Combining low cost with a 35% market share puts the country in a very respectable competitive position. South Africa’s key advantage is fibre cost, which is also the highest contributor to cost in most if not all T&T operations worldwide. Key disadvantages are energy and labour. Energy, especially power cost, is high in South Africa compared to other countries. Labour cost varies from higher-than to lower-than other countries with a slight disadvantage to countries with larger market shares.
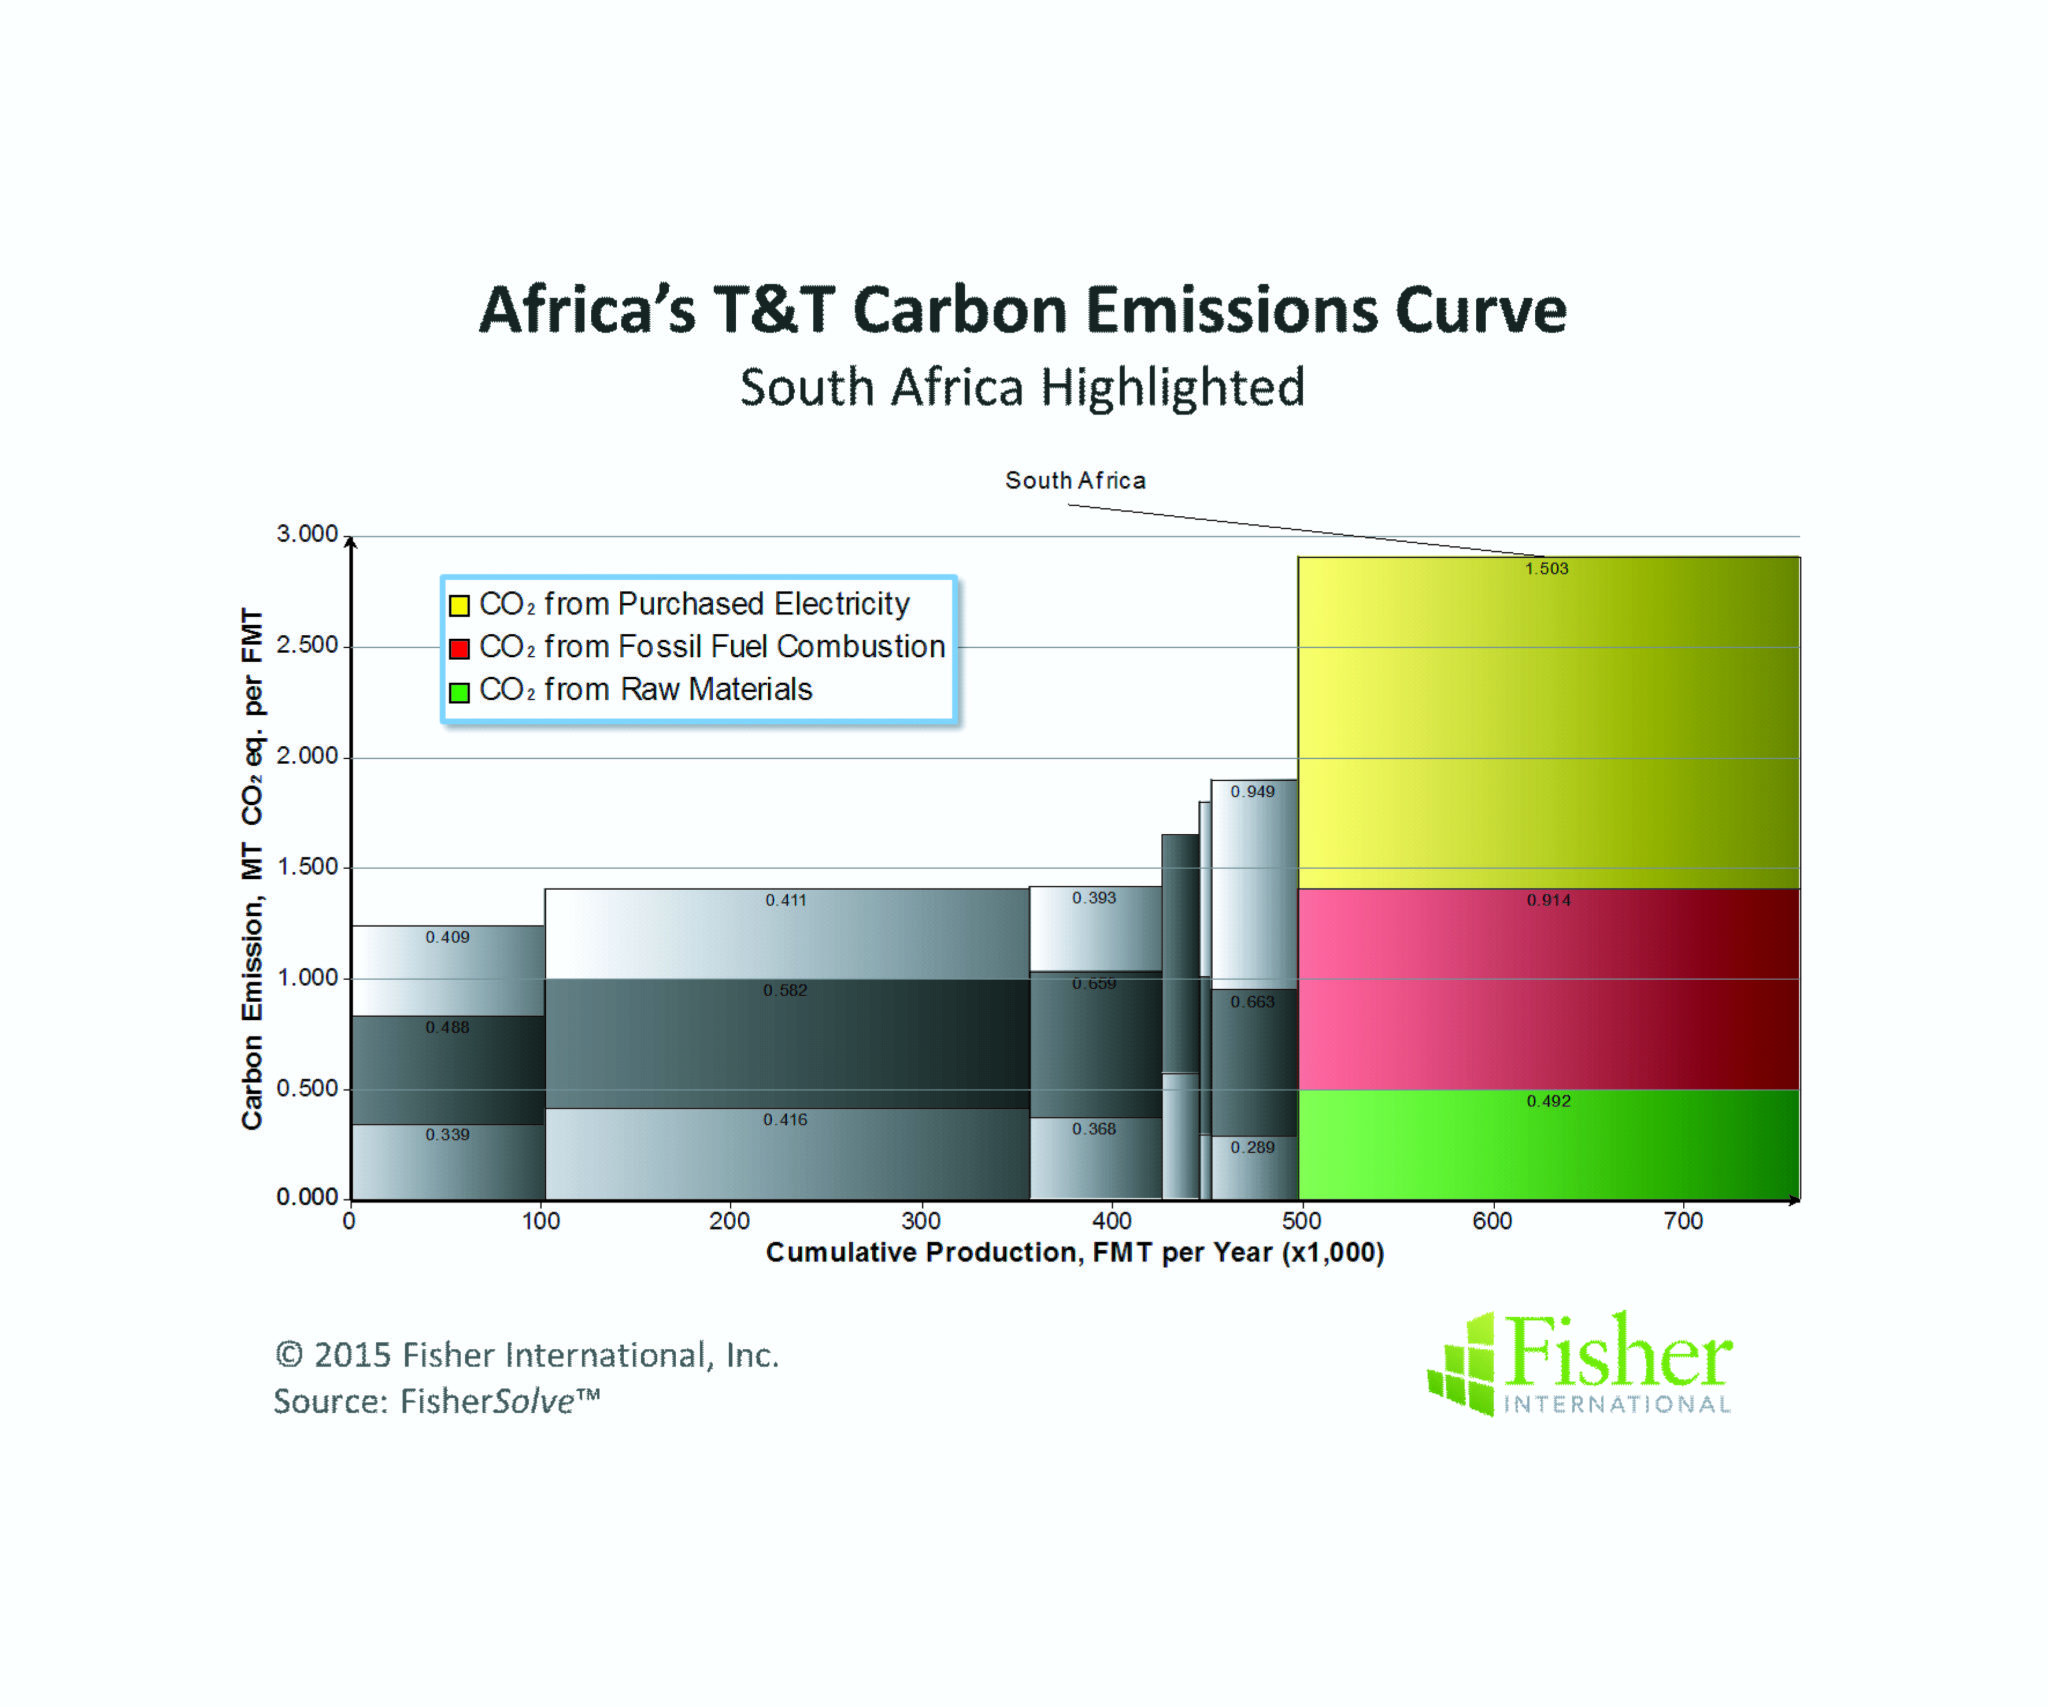
South Africa’s carbon footprint is a potential future cost issue; it has the highest carbon load of the African T&T producing countries (Figure 10). The issue is, again, purchased power. South Africa is very heavily dependent on coal for manufacturing and power generation. For mills burning coal and pulling power from coal generation-based utilities, this could become a cost issue as regulations force mitigation or conversion to alternative sources of power.
The source for market data and analysis in this article is FisherSolve™. Data tables behind Figures 1 – 10 can be obtained from Fisher International. E-mail requests to [email protected].
About Fisher International, Inc.
Fisher International has supported the pulp and paper industry for over 25 years with business intelligence and management consulting. Fisher International’s powerful proprietary databases, analysis tools, and expert consultants are indispensable resources to the industry’s producers, suppliers, investors, and buyers worldwide.FisherSolve™ is the pulp and paper industry’s premier database and analysis tool. Complete and accurate, FisherSolve is unique in describing the assets and operations of every mill in the world (making 50 TPD or more), modeling the mass-energy balance of each, analyzing their production costs, predicting their economic viability, and providing a wealth of information necessary for strategic planning and implementation. FisherSolve is a product of Fisher International, Inc. For more information visit: www.fisheri.com or email [email protected] USA: +1-203-854-5390


