


By Bill Burns, Senior consultant, Fisher International


Scandinavia (Sweden, Norway and Denmark) is well known for producing pulp and paper products for both the local market and export. Exports are heavily focused on Western European countries but the reach goes well beyond Europe. Key paper products include Packaging and Printing/Writing grades representing 56% of total pulp and paper capacity. Market Pulp is also a major product at 29% of total capacity and a significant contributor to exports.
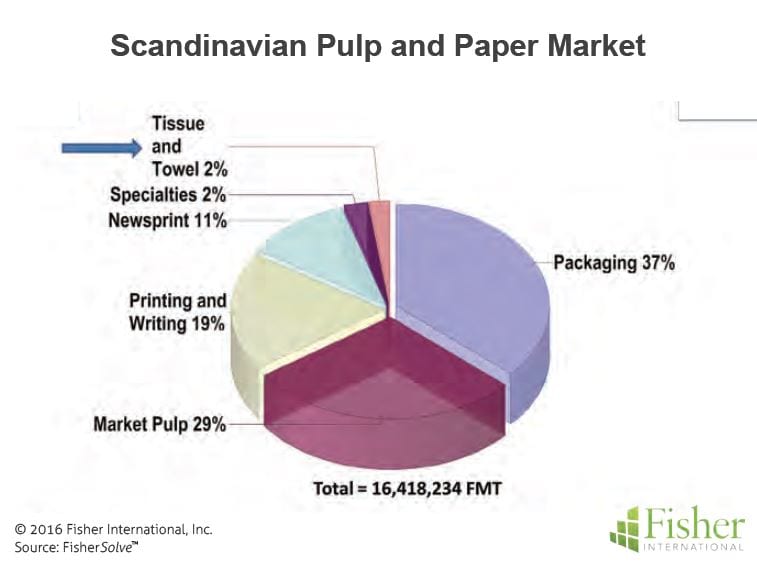
Towel and Tissue (T&T), the focus of this article and also a part of the Scandinavian product portfolio, is not heavily involved in the export trade beyond the area. In fact, T&T products represent a mere 2% of the Scandinavian pulp and paper market (Figure 1).
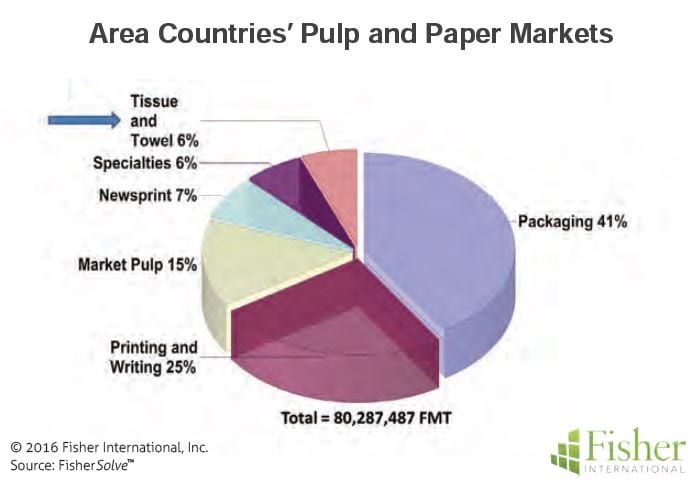
While it is possible for tissue producers to compete all over Europe, we have restricted our market comparison to a handful of Western-European and Baltic-State tissue making countries in close proximity to Scandinavia (Belgium, Finland, France, Germany, Lithuania, the Netherlands, Poland, and the UK). Production capacity mix in this broader market area is similar to that of Scandinavia except when it comes to T&T and Market Pulp. Printing/Writing and packaging grades represent 66% of the market while Market Pulp is 15% versus Scandinavia’s 29% (Figure 2). T&T is about 6% of the market among the countries collectively, three times that of Scandinavia at 2%.
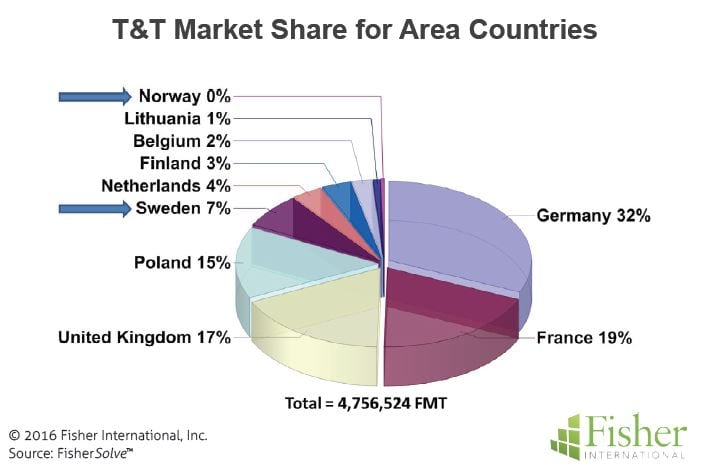
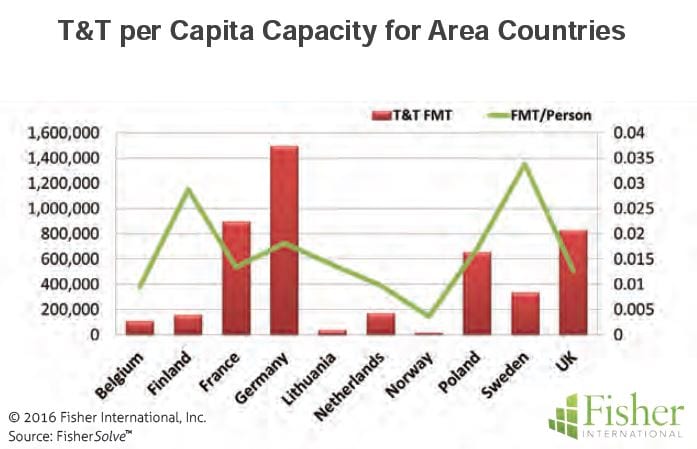
Area T&T market share heavily favours Germany, France, Poland and the United Kingdom which collectively accounts for 83% of the capacity in line with their sizeable population which is more than ten times that of Scandinavia’s 21 million people. In proportion to their market size, the three Scandinavian countries account for 7% of the market with Swedish mills owning nearly all of that capacity (Figure 3). Sweden has the highest per capita T&T production rate in the area (Figure 4) which likely speaks to its T&T export market.
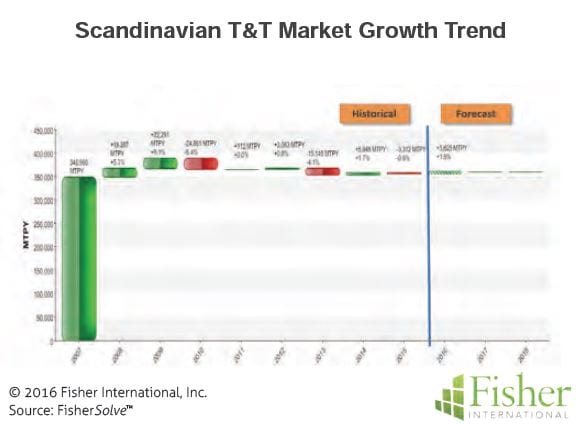
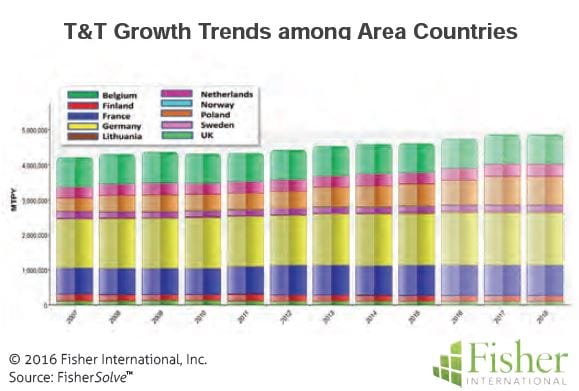
Capacity growth in the area has been relatively flat. Scandinavian countries experienced an uptick in capacity during the 2008 to 2009 period (Figure 5). Since then, the growth rate has seen little change and, based on announcements, it appears the trend will continue for the near future. Only Lithuania and Poland show signs of growth. Lithuania leads with a historical Cumulative Average Growth Rate (CAGR) of 10.8% while Poland is posting appreciable future growth (Figure 6). There are no announced capacity changes for the other countries.
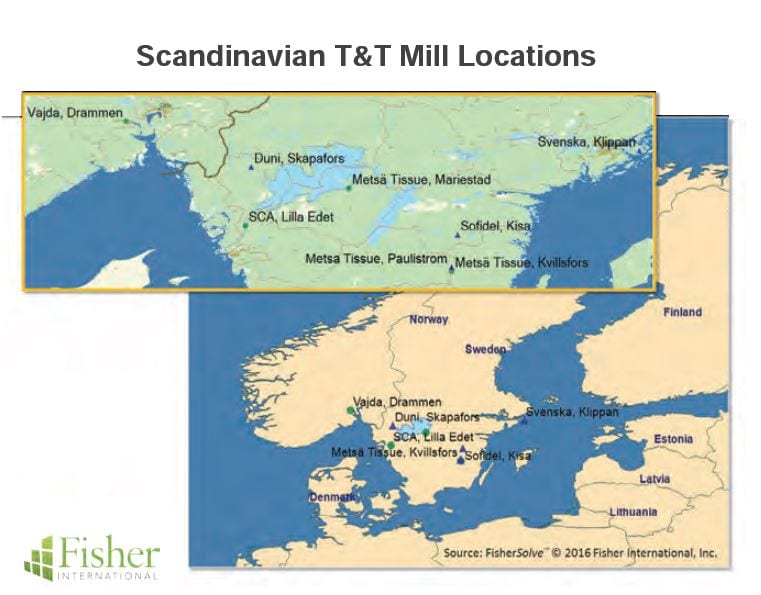
As noted earlier, Scandinavia’s T&T business is concentrated almost exclusively in Sweden. Thirteen of the 14 T&T machines in Scandinavia are located in Sweden. Norway accounts for one machine and Denmark has none. Norway’s machine is running fully on recycled fibre while Swedish machines average about 60% Kraft and 40% recycled fibre in their furnish (Figure 7).
Fibre mix among the remainder countries in the area varies greatly. Those of the three largest producing countries are similar to Sweden with 50% or greater virgin fibre.
The 14 machines in Scandinavia range in age from mid to late 1900s. Speeds tend to reflect age with the slowest machines being from the 1950s and the faster machines being installed later in the century. All of the machines are in the 2.5 to 3.0 metre class. (Figure 8). Company share of capacity is heavily weighted to Metsä Tissue at 36% and SCA at 27%. Sofidel also has a significant presence of 17% (Figure 9).
Cost competiveness is fairly intense among these European countries. France, Germany and the United Kingdom dominate the capacity and have similar cost positions. They set the median cost benchmark for the area. The Scandinavian producing countries are cost competitive but not to an extent that would command significant market price influence (Figure 10).
Looking inside the numbers, Sweden has a disadvantage in energy and labour costs compared to the lowest-cost major producing country.
Poland on the other hand has a big advantage in labour cost. Sweden is neither advantaged nor disadvantaged compared to the other major producers Germany, France and the UK. Norway has an advantage in fibre and is well positioned with energy but is at a disadvantage in labour compared to all the other major producing countries.
Carbon emissions are often considered, along with cost, as an indicator of potential future capital and operating mitigation costs that could impact overall cost position. Scandinavia in general (and Sweden in particular) has very low emission rates compared to the other countries in the region (Figure 11). Worldwide, Sweden is solidly a first quartile in emissions and presumably has less future capital cost risk because of it (Figure 12).
The source for market data and analysis in this article is FisherSolve™.
Data tables behind Figures 1 – 11 can be obtained from Fisher International. Email requests to [email protected].


