


By Bill Burns, Senior Consultant, Fisher International
The Middle East and Africa represent about 2% each of the global Towel and Tissue (T&T) capacity. If you consider Egypt as more a part of the Middle East than Africa the Middle East would still only represent 3% of the total global T&T capacity. For this paper we will consider the Middle East including Egypt and provide country profiles for both Egypt and Jordan.
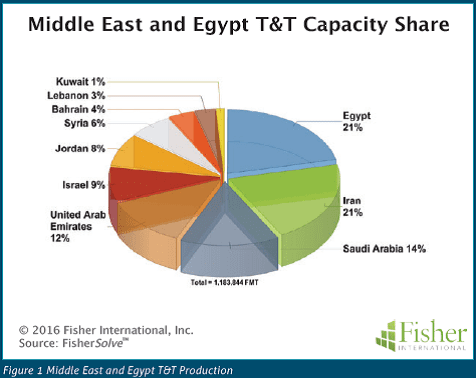

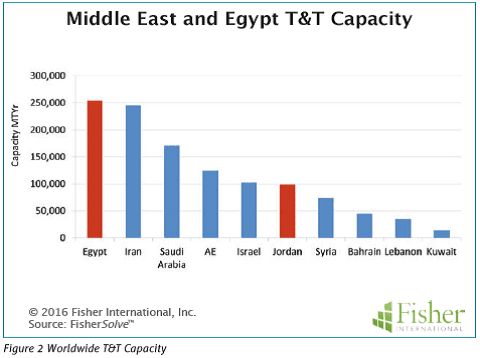


In composite Egypt-Middle East totals about 1.2 million metric tonnes of T&T capacity. Egypt and Iran hold the highest share position at 21% each while Jordan has a much smaller 8% share (Figure 1). Actual capacity for Egypt is slightly higher than Iran and about 2.5 times that of Jordan (Figure 2).
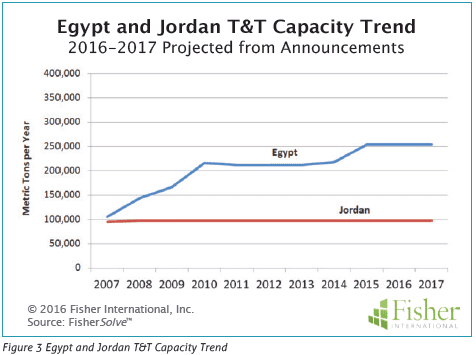
Egypt’s position is a fairly recent phenomenon, experiencing a steady growth rate of 11.6% CAGR (cumulative average growth rate) over the past seven years (Figure 3). Jordan, on the other hand, has not grown over the same period. Typically economic conditions in the country and population dynamics are behind paper industry growth.
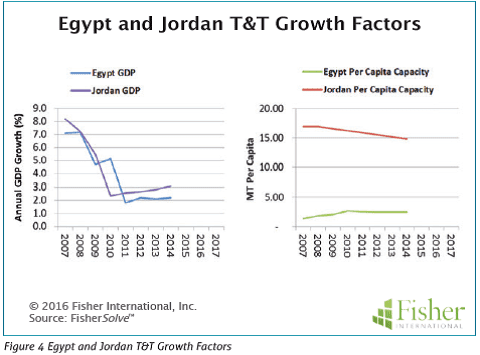
Historical economic conditions for Egypt and Jordan have a very similar trend with GDP of both countries trailing off from ~7.5% to ~2.5% with the 2008-2009 global recession (Figure 4). Capacity per capita shows that Egypt had surged for a couple of years then levelled out while Jordan has steadily decreased over the seven-year period (Figure 4). The machine base in the Middle East is predominantly very modest in size so the growth history is reflected by increasing number of machines over time.
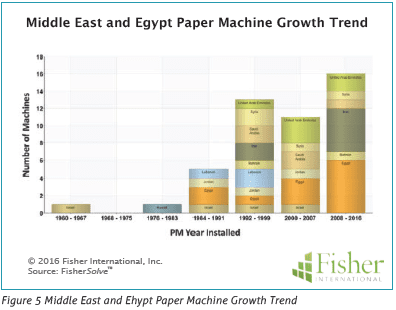
A time line of machine installations illustrates investment developments in the area and the absence of recent activity in Jordan is consistent with its decline in per capita capacity (Figure 5).
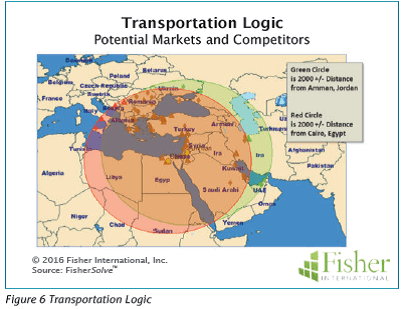
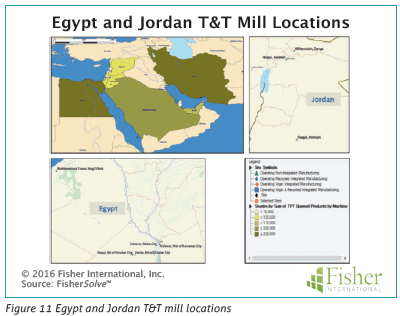
External markets and competitors are also a consideration when assessing growth. Logical markets and potential competitive threats within reasonable transportation distances overlap for Egypt and Jordan. Figure 6 is a plot of potential markets and competitive mills within 2,000km representing the market range for both countries. The area, which includes Turkey and Greece, is rich in T&T making suggesting import pressure likely to outweigh export opportunities. Consequently, the market will be mostly local.
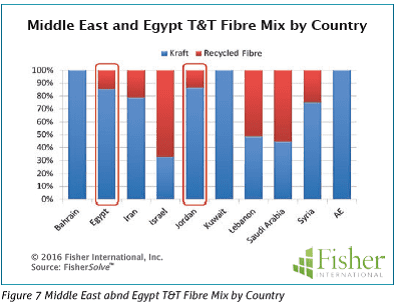
Worldwide, in general, as well as in the Middle East, fibre is the largest cost factor for T&T paper making and a key factor in competiveness. Generally, integrated fibre is lower cost than purchased with integrated secondary being lower cost than virgin. Market pulp is on the top end of the cost scale. The fibre mix in the Middle East is a combination of recycled and market pulp with a bias toward market pulp. Egypt and Jordan have similar mixes with relatively small amount of recycled at ~15% (Figure 7).
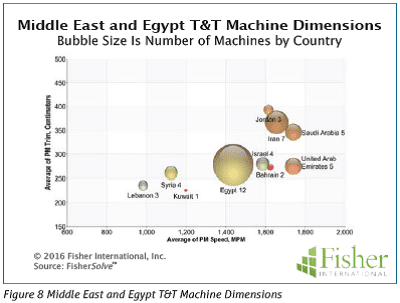
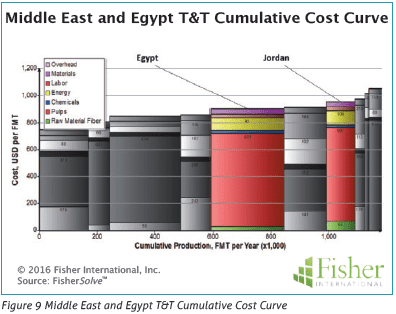
Machine configuration is also a consideration in cost to produce. Slow narrow machines have poorer production rates than fast wide machines when running at similar efficiencies. Egypt and Jordan machines are narrow with very respectable speeds. Jordan machines are on average wider that Egypt at 3.5 metres versus 2.5 metres. Jordan machines also average faster with run rates of approximately 2,000mpm (Figure 8). Within the area, Egypt and Jordan are similar in paper cost with both countries in the third quartile of area cost (Figure 9).
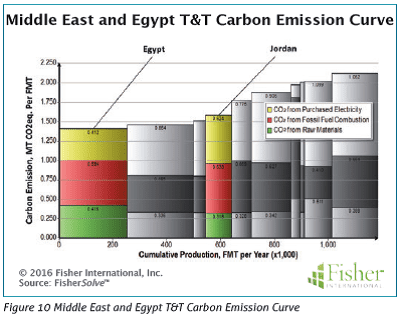
Head to head Egypt has a slight cost advantage at the paper machine level. Key drivers for the difference lie in about $60 FMT fibre and energy cost in Egypt. Carbon footprint is a pote
ntial future cost issue for many T&T mills (Figure 10). Egypt and Jordan are both in an advantageous first-or second-quartile emissions rate position for the area. Internationally they are both second-quartile with Jordan very near the median.
The source for market data and analysis in this article is FisherSolve™. Data tables behind Figures 1-10 can be obtained from Fisher International. E-mail requests to [email protected].


