


By Bill Burns, Senior consultant, Fisher International
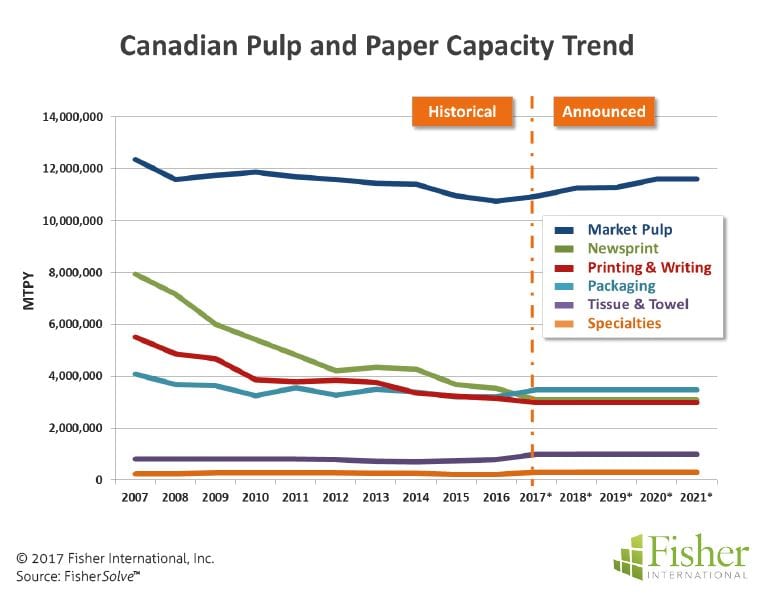
Over the past ten years (2007-2017) the pulp and paper industry has experienced a market shake up. Grades like Newsprint and Printing & Writing have lost significant user base as electronic media gains in acceptance and popularity. The capacity trend for these two grades indicates a whopping negative cumulative average growth rate (CAGR) of -5.8% for Newsprint and -1.7% for Printing & Writing grades.
Not all grades have been caught up in this shake up. Market Pulp, Packaging, Specialties and Tissue & Towel (T&T) have positive growth trends.
Over the past ten years, T&T has seen the most growth with a CAGR at 5.49% followed by Packaging at 3.64%. Canada’s pulp and paper industry is a little bleak compared to high-growth regions but not unlike the global picture.
In Canada, all grades show negative CAGRs for the ten-year period with Newsprint capacity shrinking at -8.59% per year followed by Printing & Writing at -6.02%. Tissue & Towel is the least negatively impacted with a CAGR of -0.44% (Figure 1).
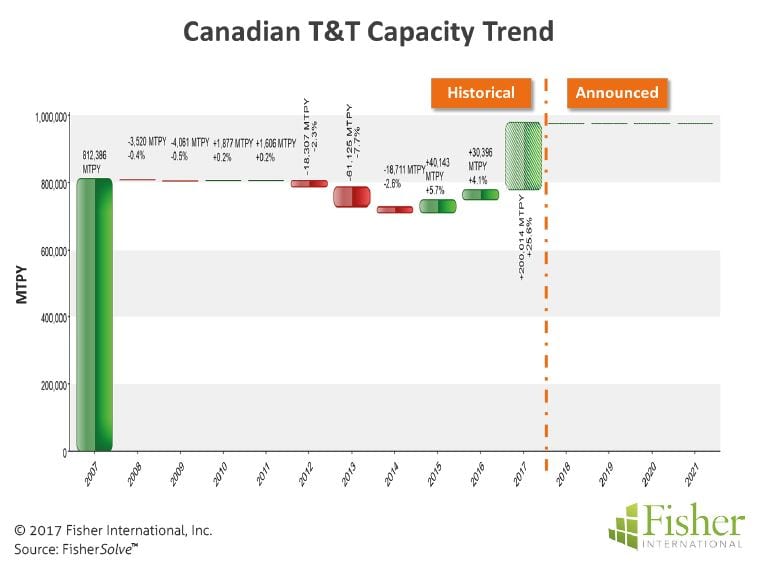
Focusing on Canadian T&T capacity trends, we can see disconnects with the global trend. Canada T&T capacity was stagnant for the first years of the ten-year period while globally, T&T capacity was on a steady increase. For three years starting in 2012 the Canadian T&T capacity went into a decline giving up more than 10%.
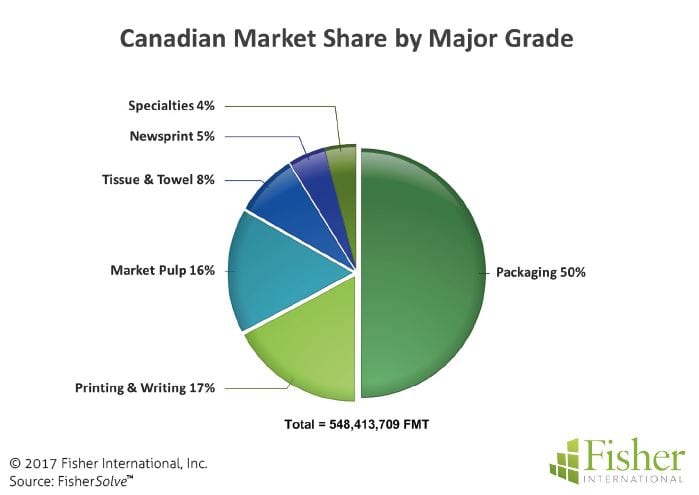
The decline leveled and started to reverse at the end of 2014 resulting in a modest growth in 2015 and 2016. A significant Printing & Writing machine rebuild is entering the T&T market which will complete the recovery and add about 15% above the pre-2012 baseline (Figure 2). Although this rebuild is significant for T&T, at 8% of the total Canadian pulp and paper market, it will do little to offset the overall declining trend (Figure 3).
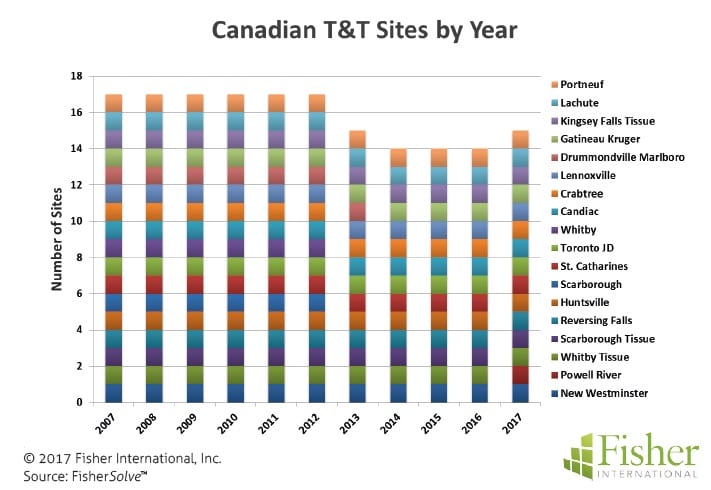
Looking closer at the changes over the past ten years, in 2007 eight companies made up the Canadian T&T market. In 2012 there were still eight companies, however ownership changed hands with one of the eight. After 2012, there was a decline in Canadian capacity. By 2014, the decline was over and there were two less companies leaving the count at six (Figure 4).
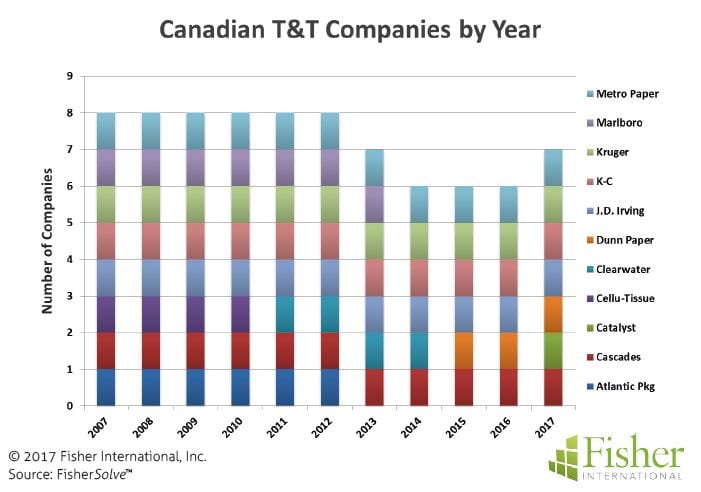
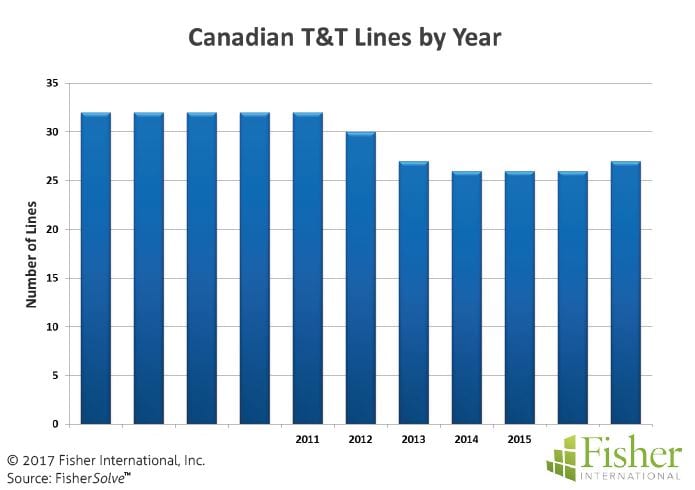
After 2014 there were a couple more ownership changes and a new entry going into 2017. As expected, this pattern is evident at the sites and line levels too (Figures 5 and 6).
Despite shrinking in overall capacity, there have been some pockets of positive change. There were two major and a couple of minor rebuilds during the ten-year window under review. Both major rebuilds involved converting from conventional tissue making in the realm of Advanced Technology.
One of the machines went the TAD (Through Air Drying) route while the other did an extensive rebuild to the Voith ATMOS process. The ATMOS rebuild took a 25+ age machine and brought the “technical age” down to 9.75, making it the technically newest machine in Canada.
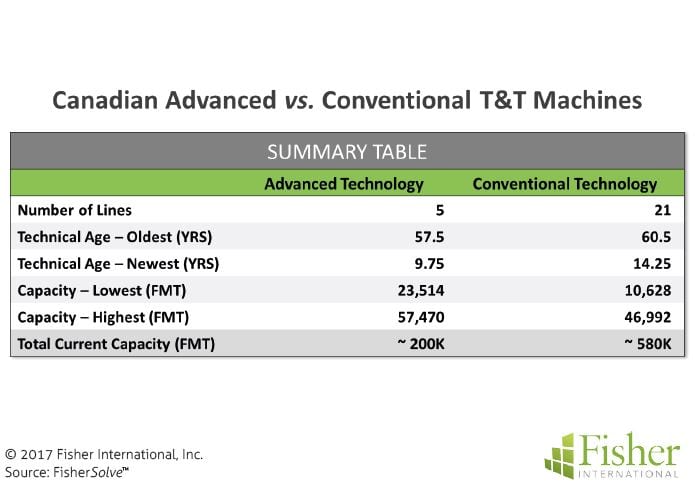
It may be interesting at this point to take a side step and look at some data on Conventional versus Advanced Technology machines in Canada. Advanced machines number five, while there are 21 Conventional machines.
Measured by technical age, the newest Advanced machine is the one noted earlier at 9.75 years while the newest Conventional machine is 14.25 years. Comparing capacity, the highest advanced machine can produce more than 57K FMT while the highest Conventional machine can produce in the 47K FMT range. (See Figure 7 summary table for this and more information.)
Cost benchmarking across the ten-year window revealed some interesting facts. From a cost quartile position, Canada’s T&T cost ranks 13th among the 76 T&T producing countries. (Interestingly, Canada is also 13th in production.)
From a cost quartile perspective Canada is just above the transition point from 3rd to 4th quartile (Figure 8). Relative to all other countries labour cost is likely their biggest disadvantage (Figure 9). Looking back to 2007 the Canadian cost position has not changed over the past decade (Figure 10).
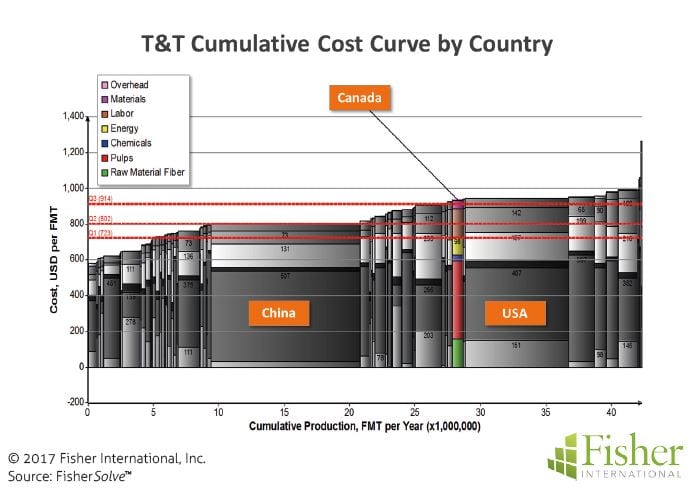
When comparing 2007 to 2017 it is interesting to note the movement of other countries relative to Canada. The United States for example was much lower cost in 2007 than it is today. China is also a very interesting example where it held about the same cost position but has ballooned in capacity.
Canada’s T&T market is a steady slow-growth business. Geographically, the country is second largest in the world and endowed with abundant water and forest resources. Demographically, Canada’s population of 35+ million is growing at a positive albeit low rate of 0.74% per year. People are concentrated in the more moderate climate regions along the Northeastern, Northwestern, and United States boarder. As expected, T&T capacity is located in and near the population centres, as shown on the map.


The source for market data and analysis in this article is FisherSolve™.
About Fisher International, Inc.
Fisher International supports the pulp and paper industry with business intelligence and strategy consulting. Fisher International’s rich databases, powerful analytics, and expert consultants are indispensable resources to the industry’s producers, suppliers, investors, and buyers worldwide.
FisherSolve™ is the pulp and paper industry’s premier business intelligence resource. Complete and accurate, FisherSolve is unique in describing the assets and operations of every mill in the world (making 50 TPD or more), modeling the mass-energy balance of each, analysing their production costs, predicting their economic viability, and providing a wealth of information necessary for strategic planning and implementation. FisherSolve is a product of Fisher International, Inc. For more information visit: www.fisheri.com or email [email protected] USA: +1-203-854-5390


